A UI/UX manager is concerned that a recent change in the design of a landing page may be confusing to visitors.
Which two variables would be used to evaluate the impact of the design change on site traffic to that landing page? (Choose two.)
ABounce Rate
BTime Spent on Page
CVisitors
DEntries
The Solution Design Reference (SDR) document states the expiration setting for eVar11 is “never” and the allocation is Most Recent (Last).
What happens to the persisted value when there is a new value collected for eVar11?
AThe new and old values are collected separately.
BThe old value is overwritten.
CThe old value is not overwritten.
When changing the Fallout visualization form Eventual Path to Next Hit, the analyst notices that the data reports zero Visitors across the report.
Why would this occur?
AAcross all visitors, the fallout depicted never was completed as a next step conversion.
BAcross all visitors, the fallout depicted never was completed as an eventual path conversion.
CThere was no direct path from the second and third fallout touchpoints.
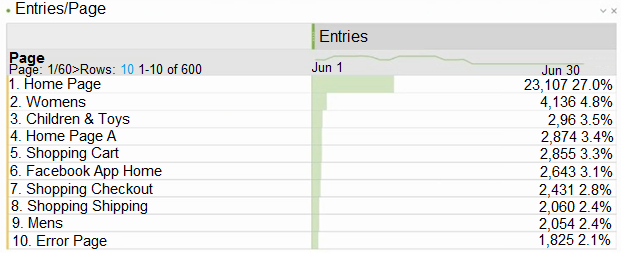
Analyzing the data in the image below, a data analyst verifies that the report of "entries" per page, shows that the "HomePage A" page is responsible for only 3.4% of the total “entries” to the site:
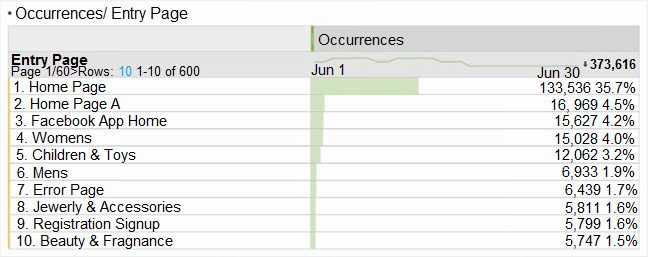
When comparing this information with the Occurrences per Entry Pages report below, it verifies that the "Homepage A” page has 4.5% of the total Occurrences of the Entry Pages:
Based on both the images and knowledge on the standard metrics of Adobe Analytics, which statement is correct?
AThe Entries metric refers to entries on a given page, and is counted every time the page loads on a visit.
BThe Entry Page Dimension refers exclusively to the first page that a visitor lands on the site on every visit, so there are distortions regarding the period of analysis.
COccurrences refers to all hits associated with a particular entry page, also counting events triggered throughout the session.
Question 6
Reporting and Analysis
0
Question 7
Workspace
Question 8
Workspace
Question 9
Reporting and Analysis
Question 10
Reporting and Analysis
Question 11
Admin and Configuration
Question 12
Workspace
Question 13
Reporting and Analysis
Question 14
Admin and Configuration
Question 15
Reporting and Analysis
Question 16
Workspace
Question 17
Admin and Configuration
Question 18
Integration and Troubleshooting
Question 19
Reporting and Analysis
Question 20
Admin and Configuration
Ask AstroTutor
0
Ask AstroTutor
0
Ask AstroTutor
0
Ask AstroTutor
0
Ask AstroTutor
0
Ask AstroTutor
0
Ask AstroTutor
0
Ad
Want a break from the ads?
Become a Supporter and enjoy a completely ad-free experience, plus unlock Learn Mode, Exam Mode, AstroTutor AI, and more.
Ask AstroTutor
0
Ask AstroTutor
0
Ask AstroTutor
0
Ask AstroTutor
0
Ask AstroTutor
0
Ask AstroTutor
0
Ask AstroTutor
0
A business owner is reviewing quarterly financial data and looks to complete projections for the upcoming quarter.
Which tool should be used to enable this analysis?
AAdobe Experience Platform
BData Feed
CMarketing Channels
A UI/UX manager asks an analyst to create an Analysis workspace visualization that shows all visits to English (/En) pages. The workspace is accessible by multiple stakeholders, most of whom have edit access.
Which visualization approach would be used?
ACreate a Freeform Table with Page Name and Visits. Filter Page Name by “ends with =/ en”
BCreate a Freeform Table with Page Name and Visits. Filter Page Name by “contains =/ en”
CCreate a Freeform Table with Visits and drag and drop all Page Names that contain “/en” from the left rail into the rows of the Freeform Table.
An analyst is co-creating a report with their client counterpart in preparation for a running marketing performance dashboard. Marketing is still getting onboarded with the analytics tool and hope to begin leveraging data to enable data-driven decisions.
How would the analyst look to share out the dashboard broadly across the team?
AShare a PDF at the time the report is completed to the client counterpart and the greater marketing team
BShare Can Edit rights with the client counterpart and Can View rights with the entire marketing team
CShare Can Edit rights with the client counterpart and Can Duplicate rights with the entire marketing team
An analyst wants to exclude visits where a page with the name “Shopping Checkout” was viewed.
How would these visits be excluded from a report?
AA visit-based segment with one include condition: Page does not equal “Shopping Checkout”
BA hit-based segment with one exclude condition: Page equals “Shopping Checkout”
CA visit-based segment with one exclude condition: Page equals “Shopping Checkout”
An analyst has been given a list of dimensions available to conduct an analysis on their hospital’s doctor site.
The Solution Design Reference (SDR) contains:
event1 – Start Appointment Booking – Set on: Appointment Booking Start event2 – Booking Complete – Set on: Appointment Booking Complete eVar1 – Doctor Type – Set on: event2 eVar2 – Number of Available Appointments – Set on event1 prop1 – Appointment Pathing
Given the SDR, which report can be generated?
ABooking Completion Rate
BTime to Book an Appointment
CLength of Appointments
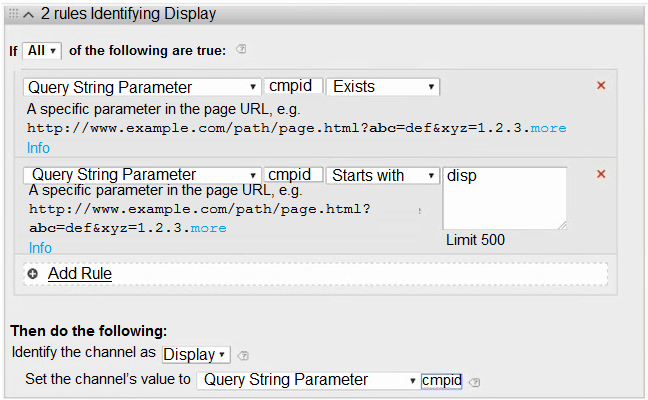
A media agency is running a Display campaign, but none of the data is credited to the Display marketing channel in Adobe Analytics.
Here are some example tracking codes provided by the media agency:
?cid=disp_lifestyle_summer2019_088653
?cid=disp_summer2019_branding_647821
?cid=disp_671244_hero_summer2019
The Marketing Channel Processing Rule for the Display channel is configured as follows:
What is causing the loss of data in Adobe Analytics?
AThe Marketing Channel processing rule is not set up to collect data for the summer2019 campaign.
BThe Marketing Channel processing rule is using a different query string parameter.
CThe variables in the tracking code are not following a consistent taxonomy.
In Analysis Workspace, what are two ways a Map Visualization can be built? (Choose two.)
ARepresenting geo segmentation data about visitor location on the DMA or Zip Code level
BUsing IP address or Latitude/Longitude
CBuilding a Map Visualization using one metric (including calculated metrics)
DBuilding a Map Visualization using two or more metrics (including calculated metrics)
A web analyst is viewing a report in an Analysis Workspace freeform table and sees a dark gray triangle.
What is this specifying in the report?
AData includes outside data source
BIncomplete data
CData anomaly detected
What is the correct functionality when setting up Intelligent Alerts?
ASend an alert by SMS with a link to your Analysis Workspace project
BSend an alert by e-mail or SMS with a link to an auto-generated Analysis Workspace project
CSend an alert by e-mail with a link to your Analysis Workspace project
A chart displaying the daily trend of Orders and their performance against the daily average for the last month is needed.
How can this requirement be met?
AUse a Line Visualization to trend the Orders and the daily average as a Calculated Metric in the same chart.
BUse a Bullet Visualization to trend the Orders and Day dimension in the same chart.
CUse a Histogram Visualization to trend the Orders and enable the settings to show the trend against the average value.
A curator clicks on a tile inside a Mobile Scorecard with no dimension applied to the tile.
Which Dimensions will be displayed as the breakdown Dimension?
ABrowser Type or Days
BPage Name or Browser
CHour or Days
A user without administrator rights needs to share an important segment with a group of users in a Product Profile.
How would the segment be shared?
AAll users and Individual Users
BIndividual Users and Product Profile Group
CAll users, Product Profile Group, or Individual Users
The Product team wants to upload product pricing data from an offline database to the Transaction ID in Adobe Analytics.
Which data import too should be used for this task?
AClassification Importer
BData Sources
CData Connector
Various reports show None, Unspecified, Other, or Unknown, depending on the specific report viewed. Generally, this breakdown means that the variable was not defined or otherwise unavailable.
Which statement explains the possible behavior of the data?
AWhen viewing classification data, any value that does not have data associated with that particular classification returns “OTHER”. To resolve this issue, create a classification export file and classify the appropriate columns.
BSimilarly to non-mobile hits in mobile reports, mobile hits in all Visitor Profile | Technology reports are listed as ‘UNSPECIFIED’.
CThis happens when a user comes to a site for the first time and makes a purchase without firing eVar1. If orders are viewed in the eVar1 report, there is no value to attribute this order to, so it will appear as “NONE”.
A key is matched to multiple rules and it sets the same classification column shown in the Set Classification column.
How can a user control the order?
ARank the most important first in the rule set.
BRank both rules using Linear in the rule set.
CRank the most important rule last in the rule set.