QuestionQ14

Reporting and Analysis

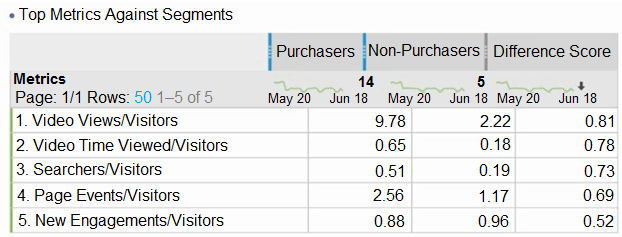
Refer to the exhibit.

Question Image

What is a valid interpretation of this Segment Comparison between the Purchasers and Non-Purchasers segments?

Explanation

For Top Metrics, Adobe Analytics calculates Difference Score using a two-sample Mann–Whitney U test and combines the observed relative difference with statistical confidence. A higher score indicates a more prominent, statistically reliable difference; therefore, the metric with the highest score is the most statistically significant difference between the segments.

Learn more

Community Discussion

No comments yet. Be the first to start the discussion!