This exam has 54 community-verified practice questions. Create a free account to access all questions, comments, and explanations.
Topics covered:
Advanced Threat Intelligence and AnalysisSecurity Data ManagementAdvanced Incident Response and ManagementAdvanced Automation and OrchestrationScaling Cybersecurity Defenses and DevSecOpsGovernance, Risk, and ComplianceMeasuring and Improving Security Program EffectivenessSecurity Capability Selection, Placement, Configuration
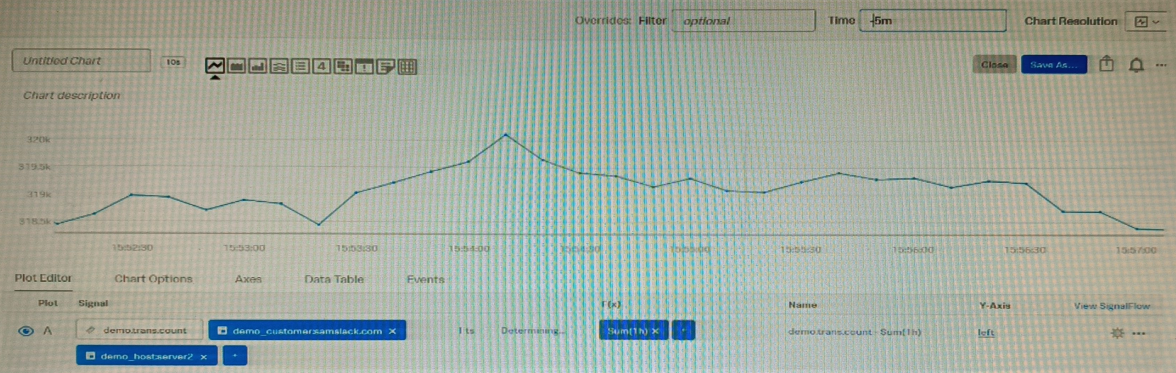
Given that the metric demo.trans.count is being sent at a 10 second native resolution, which of the following is an accurate description of the data markers displayed in the chart below?
AEach data marker represents the average hourly rate of API calls.
BEach data marker represents the 10 second delta between counter values.
CEach data marker represents the average of the sum of datapoints over the last minute, averaged over the hour.
DEach data marker represents the sum of API calls in the hour leading up to the data marker.
The built-in Kubernetes Navigator includes which of the following?
A customer deals with a holiday rush of traffic during November each year, but does not want to be flooded with alerts when this happens. The increase in traffic is expected and consistent each year. Which detector condition should be used when creating a detector for this data?
AOutlier Detection
BStatic Threshold
CCalendar Window
DHistorical Anomaly
What are the best practices for creating detectors? (Choose all that apply.)
Become a Supporter and enjoy a completely ad-free experience, plus unlock Learn Mode, Exam Mode, AstroTutor AI, and more.
Ask AstroTutor
0
Ask AstroTutor
0
Ask AstroTutor
0
Ask AstroTutor
0
Ask AstroTutor
0
Ask AstroTutor
0
Ask AstroTutor
0
Ask AstroTutor
0
Ask AstroTutor
0
What Pod conditions does the Analyzer panel in Kubernetes Navigator monitor? (Choose all that apply.)
ANot Scheduled
BUnknown
CFailed
DPending
Which of the following are supported rollup functions in Splunk Observability Cloud?
Aaverage, latest, lag, min, max, sum, rate
Bstd_dev, mean, median, mode, min, max
Csigma, epsilon, pi, omega, beta, tau
D1min, 5min, 10min, 15min, 30min
Which of the following are required in the configuration of a data point? (Choose all that apply.)
AMetric Name
BMetric Type
CTimestamp
DValue
An SRE came across an existing detector that is a good starting point for a detector they want to create. They clone the detector, update the metric, and add multiple new signals. As a result of the cloned detector, which of the following is true?
AThe new signals will be reflected in the original detector.
BThe new signals will be reflected in the original chart.
CYou can only monitor one of the new signals.
DThe new signals will not be added to the original detector.
A Software Engineer is troubleshooting an issue with memory utilization in their application. They released a new canary version to production and now want to determine if the average memory usage is lower for requests with the 'canary' version dimension. They've already opened the graph of memory utilization for their service. How does the engineer see if the new release lowered average memory utilization?
AOn the chart for plot A, select Add Analytics, then select Mean:Transformation. In the window that appears, select the Group By field.
BOn the chart for plot A, scroll to the end and click Enter Function, then enter 'A/B-1'.
COn the chart for plot A, select Add Analytics, then select Mean:Aggregation. In the window that appears, select 'version' Group By field.
DOn the chart for plot A, click the Compare Means button. In the window that appears, type 'version'.
One server in a customer's data center is regularly restarting due to power supply issues. What type of dashboard could be used charts and create detectors for this server?
ASingle-instance dashboard
BMachine dashboard
CMultiple-service dashboard
DServer dashboard
To refine a search for a metric a customer types host:test-*. What does this filter return?
AOnly metrics with a dimension of host and a value beginning with test-.
BError
CEvery metric except those with a dimension of host and a value equal to test-.
DOnly metrics with a value of test- beginning with host.
A customer operates a caching web proxy. They want to calculate the cache hit rate for their service. What is the best way to achieve this?
APercentages and ratios
BTimeshift and Bottom N
CTimeshift and Top N
DChart Options and metadata
Which of the following are correct ports for the specified components in the OpenTelemetry Collector?
AgRPC (4000), SignalFx (9943), Fluentd (6060)
BgRPC (6831), SignalFx (4317), Fluentd (9080)
CgRPC (4459), SignalFx (9166), Fluentd (8956)
DgRPC (4317), SignalFx (9080), Fluentd (8006)
When writing a detector with a large number of MTS, such as memory.free in a deployment with 30,000 hosts, it is possible to exceed the cap of MTS that can be contained in a single plot. Which of the choices below would most likely reduce the number of MTS below the plot cap?
ASelect the Shared option when creating the plot.
BAdd a filter to narrow the scope of the measurement.
CAdd a restricted scope adjustment to the plot.
DWhen creating the plot, add a discriminator.
An SRE creates a new detector to receive an alert when server latency is higher than 260 milliseconds. Latency below 260 milliseconds is healthy for their service. The SRE creates a New Detector with a Custom Metrics Alert Rule for latency and sets a Static Threshold alert condition at 260 ms. How can the number of alerts be reduced?
AAdjust the threshold.
BAdjust the Trigger sensitivity. Duration set to 1 minute.
CAdjust the notification sensitivity. Duration set to 1 minute.
DChoose another signal.
Where does the Splunk distribution of the OpenTelemetry Collector store the configuration files on Linux machines by default?
A/opt/splunk/
B/etc/otel/collector/
C/etc/opentelemetry/
D/etc/system/default/
Which of the following rollups will display the time delta between a datapoint being sent and a datapoint being received?
AJitter
BDelay
CLag
DLatency
Which of the following is optional, but highly recommended to include in a datapoint?
AMetric name
BTimestamp
CValue
DMetric type
Which analytic function can be used to discover peak page visits for a site over the last day?
A customer has a large population of servers. They want to identify the servers where utilization has increased the most since last week. Which analytics function is needed to achieve this?