A client has two datasets that are used across seven different dashboards. Three of these dashboards are used by marketing and four are used by sales. The client requires that only marketing can access the marketing dashboards and only sales can access the sales dashboards.
What solution should be recommended?
ADuplicate the datasets and create two custom apps: one for marketing dashboards and datasets with marketing as "editor" and one for sales dashboards and datasets with sales as "editor."
BCreate three custom apps: one for marketing dashboards with marketing as "viewer," one for sales dashboards with sales as "viewer," and one for datasets where marketing and sales are "viewer."
CCreate one custom app for the datasets and share it with marketing and sales as "viewer."
DCreate two custom apps: one for marketing dashboards with marketing as "viewer" and one for sales dashboards with sales as "viewer." Add the datasets as references to both custom apps.
A Tableau CRM consultant develops a dashboard called SalesPerformance_1 in a sandbox environment. To deploy the recipe, the consultant creates a package in workbench.
What is the correct meta data reference in the xml file?
ASalesPerformance_1 EADashboard
BSalesPerformance_1 WaveDashboard
CSalesPerformance_1 EdgeDashboard
DSalesPerformance_1
A consultant built a very useful Einstein Analytics app for the corporate Sales Operations team of a company that has multiple Salesforce Orgs. Each Org has similar models and would like to review their data the way that the corporate Sales Operations team does. The app has been packaged and needs to be installed on the other production orgs.
What is the recommended practice to install the custom templated app?
AChange Sets
BSalesforce Managed Package
CREST API
DMetadata API
Your sales team requests that datasets for their dashboards are refreshed every hour. You agree to investigate if this is possible and find that the dashboards use 5 datasets created from two recipes. The first recipe takes 43 min to run and the second recipe takes 25 min to run.
Is it possible to refresh data every hour?
ANo, the total duration of the recipe jobs exceeds one hour.
BYes, the number of recipe runs does not exceed the limit of 60 in a 24 hour rolling period.
CYes, with two concurrent recipe runs the duration is less than an hour.
DNo, the number of recipe runs exceed the limit of 40 in a 24 hour rolling period.
Question 6
Data Layer
0
Question 7
Einstein Discovery Story Design
Question 9
Analytics Dashboard Implementation
Question 10
Security
Question 11
Analytics Dashboard Implementation
Question 12
Analytics Dashboard Design
Question 13
Analytics Dashboard Design
Question 14
Security
Question 15
Data Layer
Question 16
Security
Question 17
Einstein Discovery Story Design
Question 18
Data Layer
Question 19
Analytics Dashboard Implementation
Question 20
Analytics Dashboard Implementation
Question 21
Data Layer
Question 22
Analytics Dashboard Implementation
Question 23
Data Layer
Question 24
Analytics Dashboard Implementation
Question 25
Security
Question 26
Analytics Dashboard Implementation
Ask AstroTutor
0
Ask AstroTutor
0
Ask AstroTutor
0
Ask AstroTutor
0
Ask AstroTutor
0
Ask AstroTutor
0
Ask AstroTutor
0
Ad
Want a break from the ads?
Become a Supporter and enjoy a completely ad-free experience, plus unlock Learn Mode, Exam Mode, AstroTutor AI, and more.
Ask AstroTutor
0
Ask AstroTutor
0
Ask AstroTutor
0
Ask AstroTutor
0
Ask AstroTutor
0
Ask AstroTutor
0
Ask AstroTutor
0
Ask AstroTutor
0
Ask AstroTutor
0
Ask AstroTutor
0
Ask AstroTutor
0
Ask AstroTutor
0
A Tableau CRM consultant has created three recipes that each produce a dataset.
• Recipe1 creates Dataset1.
• Recipe2 created Dataset2.
• Recipe3 creates Dataset3.
Recipe3 is dependent on Dataset1, while Recipe1 and Recipe2 have no dependencies.
How should the consultant implement the recipe schedule?
AMake Recipe1 and Recipe2 time based, but make Recipe3 event based when the local Salesforce connector has completed.
BMake all three recipes time based and schedule all of them at the same time, the data manager will automatically run them in the correct order.
CMake Recipe1 and Recipe2 time based, but make Recipe3 event based when Recipe1 has successfully completed.
DMake Recipe1 and Recipe2 time based, but make Recipe3 event based when Recipe1 and Recipe2 have successfully completed.
A story created has an AUC of .62.
What two things could be done to possibly improve this AUC score? (Choose two.)
AChange the order of the story insights to descending.
BAdd more rows of relevant data.
CRun detect sentiment on the dataflow before creating the story.
DSegment the training set.
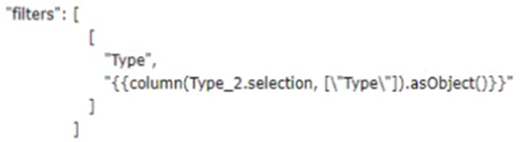
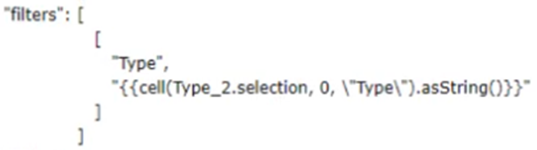
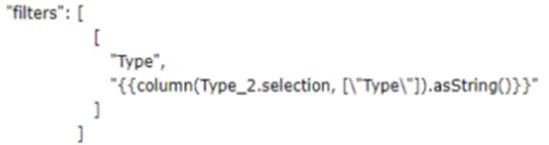
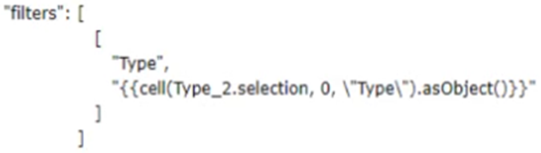
The Universal Containers Einstein Analytics team built a dashboard with two widgets:
List widget associated to the query Type_2" and grouped by the dimension "Type" (multi-selection)
Pie chart widget associated to the query "Step_pie_3" and grouped by the dimension "Type"
Additional notes:
The queries use different datasets.
Users should be able to choose more than one Type (multi-selection)
What is the right syntax for the binding/interaction?
A
B
C
D
A Tableau CRM Consultant is implementing encryption for a customer.
Which two statements about Tableau CRM Encryption are true? (Choose two.)
ABy default, the same keys are used to encrypt data in Tableau CRM as are used to encrypt data in Salesforce objects.
BThe customer's org must have a tenant secret persisted in the Shield Platform key management store.
CWhen Tableau CRM Encryption is enabled, all newly registered datasets are encrypted at rest.
DBring Your Own Key is supported only if replication is enabled.
A consultant built a Tableau CRM app for the Sales Operations team. The Sales Operations team wants to share their app with other people at the company. The consultant recommends distributing the app as a Tableau CRM template app.
A set of JSON files will be generated after a template is created from the Sales Operations app.
What is the name of the JSON file that manages template metadata and all other template elements?
Amaster-info.json
Btemplate-to-app-rules.json
Cui.json
Dtemplate-info.json
Universal Containers has a Dashboard for Sales Managers. They need to visualize their win rate.
Which chart type can be used to keep track if they are below or beyond the target?
AMetric Radar
BHeatmap
CLine
DGauge
A customer displays a lot of data and wants a way to dynamically emphasize certain values on a bar chart in order to properly grab the user’s attention.
What can a Tableau CRM Consultant use to accomplish this task?
AXMD
BCustomize tooltip
CCompare Table
DChart Markers
A Tableau CRM consultant receives a new project from a client that wants to implement Tableau CRM. They do not currently have Tableau CRM, but want guidance around how to ensure that their users have correct access.
They have 1000 users with a small team of three people who will build datasets and dashboards. An additional 15 people should be able to create dashboards. The remaining users should only be able to view dashboards.
Which recommendation should the consultant give the client?
AAssign the app permissions “viewer,” “editor,” and “manager” to the three types of roles defined.
BCreate and assign three new Salesforce profiles according to the three types of roles defined.
CAssign “Tableau CRM Explorer” licenses to users that should only view the dashboard, and assign “Tableau CRM Developer” licenses to users that should be able to create datasets and dashboards.
DCreate and assign Salesforce permission sets according to the three types of roles defined.
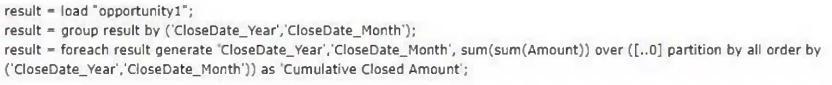
Which set of statements generates monthly amount on a cumulative basis annually?
A
B
C
D
A company uses role hierarchy to implement data security in Salesforce. They want the same role-hierarchy-based security model to apply in Tableau CRM, but want the users in a role to see data owned by other users in the same role.
Using the "flatten” transformation in a recipe, which attribute setting achieves this requirement?
ASet the attribute “Include Record ID Column value” to true.
BSet the attribute “include_self_id” to false.
CSet the attribute “include_self_id” to true.
DSet the attribute “Include Record ID Column value” to false.
A training dataset is being prepared for an Einstein Discovery story. One of its predictor (input) fields is skewed with outliers.
What action should the Einstein consultant take?
AChange the method of binning to fixed width.
BNothing, because the field is not the outcome variable.
CRemove the outlier rows.
DRemove the field because it has bad data.
A client has a dashboard for Sales Managers. They want to have a list filter that shows the name of the month. However, based on the "CloseDate_Month" field, the list filter shows numbers instead of names.
Which recipe transformation can a Tableau CRM consultant use to generate the name of month as a new dimension in the dataset?
Aflatten
Bcluster
Cbucket
Dformat dates
A list widget is added to a dashboard with existing charts and tables. What must be true for the list widget to facet the dashboard charts and tables using widget properties?
AThe list, chart, and table queries must share a common name.
BThe list, chart, and table queries must share common dimensions from different datasets.
CThe list, chart, and table queries must share the same dataset.
DChart and table queries must have their own list widgets.
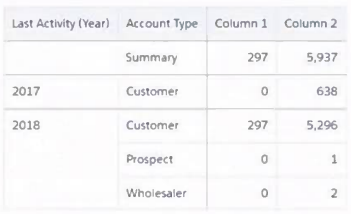
Universal Containers has a Sales Manager dashboard. They need to build a table as shown in the graphic and calculate the summary as the first line in a compare table.
How can the summary be calculated?
AUse a SAQL query since the summary is not available in standard interface.
BCreate a computeExpression field in the Dataflow to calculate the summary.
CUse the Show Summary option in the compare table.
DAdd a formula field to calculate the summary.
Universal Containers is evaluating the connection mode for the objects in their local Salesforce connector. They want to only sync updated and new records from the Order object, but they have some formula fields on the object and want to ensure those are updated weekly.
Which connection mode is best suited for this purpose?
AFull Sync
BIncremental Sync
CPeriodic Full Sync
DPeriodic Incremental Sync
A Tableau CRM consultant has been asked to refactor a dashboard so that it loads more quickly. After some analysis, the consultant found that most of the dashboard queries run in less than five seconds; however, the Opportunities Table takes 30 seconds to run.
How can the consultant improve the performance of this dashboard?
ACreate a Visualforce page and display a list view of the opportunities on this new page.
BCreate a link to download the list of opportunities as an Excel file.
CCreate a second page on the dashboard and move the table to this new page.
DCreate a second dashboard and move the table to this new dashboard.
A company used Tableau CRM to create two datasets:
"OpportunityWithAccount" dataset, which contains data from the Opportunity standard object augmented by the Account data.
"CaseWithAccount" dataset, which contains data from the Case standard object augmented by the Account data.
The company wants to build a lens showing the total number of Opportunities and Cases per Account.
How can a consultant help them build this lens?
AUse "Compare Table" to join the "OpportunityWithAccount" and "CaseWithAccount" datasets using the "AccountId" and then aggregate by Account.
BUse a SAQL query to group and join the "OpportunityWithAccount" and "CaseWithAccount" datasets then generate the results.
CUse a Salesforce Direct query to join "OpportunityWithAccount" and "CaseWithAccount" datasets.
DSet up Connect Data Sources in the UI between the "OpportunityWithAccount" and "CaseWithAccount" datasets.
Which three statements are true regarding sharing inheritance? (Choose three.)
AA dataset using sharing must also have a security predicate defined.
BIf a user can see more than 3,000 records on the object in Salesforce, but the user does not have the "View All Data" permission, sharing inheritance is not used. The backup security predicate takes effect. This limitation does not apply to the Opportunity object.
CWhen sharing inheritance is enabled, security predicates are ignored.
DSharing inheritance supports a foreign key for enforcing security.
ESharing inheritance supports Account, Campaign, Case, Contact, Opportunity, Lead, Order, and User. If you use custom objects, you must use security predicates for those.
Which widget property allows a consultant to restrict the view to a domain bounded by the values entered?