A client has a dataset comprised of Opportunity data and Opportunity Line level data. The client wants to use this dataset with Einstein Discovery to understand the Opportunity win rate.
What must be done to the dataset to achieve this goal?
AClick Create Story and Einstein will take care of the rest
BFilter to only look at isWon = True records to avoid skewing the results
CChange the grain by removing the line level detail as it will skew the win rate
DSelect the isWon = True outcome variable and generate the story
0
Question 2
Security
0
Question 3
Security
0
Question 4
Analytics Dashboard Design
0
Question 5
Analytics Dashboard Implementation
0
That's the end of the Preview
This exam has 59 community-verified practice questions. Create a free account to access all questions, comments, and explanations.
Topics covered:
Data LayerSecurityAdminAnalytics Dashboard DesignAnalytics Dashboard ImplementationEinstein Discovery Story Design
An Einstein Consultant receives a new project from a client that wants to implement Einstein Analytics. They do not currently have Einstein Analytics, but want guidance around how to ensure that their users have correct access.
They have 1000 users with a small team of three people who will build datasets and dashboards. An additional 15 people should be able to create dashboards.
Which recommendation should the consultant give the client?
ACreate and assign Salesforce permission sets according to the three types of roles defined.
BAssign the app permissions “viewer”, “editor”, and “manager” to the three types of roles defined.
CAssign “Einstein Analytics Explorer” licenses to users that should only view the dashboard, and assign “Einstein Analytics Developer” licenses to users that should be able to create datasets and dashboards.
DCreate and assign three new Salesforce profiles according to the three types of roles defined.
A large company is rolling out Einstein Analytics to their field sales. They have a well-defined role hierarchy where everyone is assigned to an appropriate node on the hierarchy.
An individual Sales rep should be able to view all opportunities that she/he owns or as part of the account team or opportunity team. The Sales Manager should be able to view all opportunities for the entire Sales team. Similarly, the Sales Vice President should be able to view opportunities for everyone who rolls up in that hierarchy.
The opportunity dataset has a field called ‘OwnerId’ which represents the opportunity owner.
Given this information, how can an Einstein Consultant implement the above requirements?
AAs part of the dataflow, use computeRelative on the RoleId field to create an attribute called ‘ParentRoleIDs’ on the opportunity dataset and apply following security predicate: ‘ParentRoleIDs’ = = “$User.UserRoleId” || ‘OwnerId’ = = “$User.Id”.
BAs part of the dataflow, use computeExpression on the RoleId field to create an attribute called ‘ParentRoleIDs’ on the opportunity dataset and apply following security predicate: ‘ParentRoleIDs’ = = “$User.UserRoleId” || ‘OwnerId’ = = “$User.Id”.
CAs part of the dataflow, use the flatten operation on the role hierarchy and create a multivalue attribute called ‘ParentRoleIDs’ on the opportunity dataset and apply following security predicate: ‘ParentRoleIDs’ = = “$User.UserRoleId” && ‘OwnerId’ = = “$User.Id”.
DAs part of the dataflow, use the flatten operation on the role hierarchy and create a multivalue attribute called ‘ParentRoleIDs’ on the opportunity dataset and apply following security predicate: ‘ParentRoleIDs’ = = “$User.UserRoleId” || ‘TeamMember.Id’ = = “User.Id” || ‘OwnerId’ = = “$User.Id”.
An insurance company has many Einstein Analytics dashboards that show the influence of weather, such as atmospheric temperature, on customer cases. A service agent commented that it is sometimes difficult to determine, by looking at a dashboard, whether the temperature data is reported in degrees Fahrenheit or in degrees Celsius.
How can a dashboard designer ensure the temperature data is easier to interpret on the dashboards?
ACustomize the number format in the number widget properties of the dashboard
BUse the XMD node in the dataflow to customize the number format of the field
CAdd a text widget to the dashboard to indicate Fahrenheit or Celsius
DIn Explorer, go to the Fields menu and then customize the number format of the measure
A consultant created an Einstein Analytics dashboard in a sandbox. Now, the dashboard needs to be migrated into production.
To complete the migration, what are the consultant’s three options? (Choose three.)
AAnt Migration Tool
BChange sets
CAnalytics External Data API
DAnalytics REST API
EAnalytics dashboard connector
Question 6
Analytics Dashboard Design
0
Question 7
Einstein Discovery Story Design
Question 8
Analytics Dashboard Design
Question 9
Analytics Dashboard Design
Question 10
Data Layer
Question 11
Analytics Dashboard Implementation
Question 12
Data Layer
Question 13
Analytics Dashboard Design
Question 14
Analytics Dashboard Design
Question 15
Analytics Dashboard Implementation
Question 16
Einstein Discovery Story Design
Question 17
Security
Question 18
Analytics Dashboard Design
Question 19
Analytics Dashboard Implementation
Question 20
Data Layer
Question 21
Data Layer
Question 22
Analytics Dashboard Design
Question 23
Analytics Dashboard Design
Question 24
Data Layer
Ask AstroTutor
0
Ask AstroTutor
0
Ask AstroTutor
0
Ask AstroTutor
0
Ask AstroTutor
0
Ask AstroTutor
0
Ask AstroTutor
0
Ad
Want a break from the ads?
Become a Supporter and enjoy a completely ad-free experience, plus unlock Learn Mode, Exam Mode, AstroTutor AI, and more.
Ask AstroTutor
0
Ask AstroTutor
0
Ask AstroTutor
0
Ask AstroTutor
0
Ask AstroTutor
0
Ask AstroTutor
0
Ask AstroTutor
0
Ask AstroTutor
0
Ask AstroTutor
0
Ask AstroTutor
0
Ask AstroTutor
0
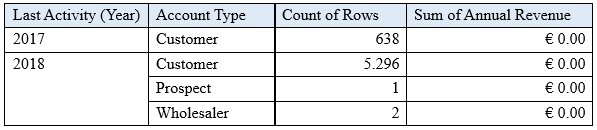
Universal Containers has a Sales Manager dashboard. They have a compare table that displays the count of Customers and the Sum of Annual Revenue per year and per Account type. A consultant is asked to add more groupings to enhance details about their customers.
What is the maximum number of grouping columns that the consultant must be aware of in order to continue using a compare table versus creating the query using SAQL?
A8
B4
C10
Dunlimited
What is an appropriate response when a client is disappointed that Einstein Discovery only detected patterns that were already known?
AHighlight that Einstein reduces time to insight, which is much faster than learning experience
BRecommend using a visualization tool, like Einstein Analytics, to uncover the details
CRemind them that the technology is only as good as the data
DAdvise them that the use case may not be accurate
Which set of statements generates monthly amount on a cumulative basis annually?
Aresult = load “opportunity1”;result = group result by (‘CloseDate_Year’,’CloseDate_Month’); result = foreach result generate ‘CloseDate_Year’,’CloseDate_Month’, sum(sum(Amount)) over ([..0] partition by ‘CloseDate_Year’ order by (‘CloseDate_Year’,’CloseDate_Month’)) as ‘Cumulative Closed Amount’;
Bresult = load “opportunity1”;result = group result by (‘CloseDate_Year’,’CloseDate_Month’); result = foreach result generate ‘CloseDate_Year’,’CloseDate_Month’, sum(sum(Amount)) over ([..] partition by ‘CloseDate_Year’ order by (‘CloseDate_Year’,’CloseDate_Month’)) as ‘Cumulative Closed Amount’;
Cresult = load “opportunity1”;result = group result by (‘CloseDate_Year’,’CloseDate_Month’); result = foreach result generate ‘CloseDate_Year’,’CloseDate_Month’, sum(sum(Amount)) over ([..0] partition by all order by (‘CloseDate_Year’,’CloseDate_Month’)) as ‘Cumulative Closed Amount’;
Dresult = load “opportunity1”;result = group result by (‘CloseDate_Year ~ ~ ~ CloseDate_Month’); result = foreach result generate ‘CloseDate_Year’,’CloseDate_Month’, sum(sum(Amount)) over ([..0] partition by ‘CloseDate_Year’ order by (‘CloseDate_Year’,’CloseDate_Month’)) as ‘Cumulative Closed Amount’;
Which chart type is suitable for rendering five measures in a lens visualization?
AMetric Radar chart
BScatter chart
CTreemap chart
DStacked Bar chart
The Universal Containers company plans to upload target data from an external tool to Einstein Analytics so they can calculate the Sales team target attainments.
The target data changes every month, so the datasets need to be updated on a monthly basis. The target data is CSV file that contains the Salesforce ID of the sales representative, the target amount, and the month of the target. For each sales representative, the file contains a target for every month of the current year as well as all previous years.
Based on this information, which operation should a consultant use with the Analytics External Data API to upload the file?
AOverwrite
BUpsert
CAppend
DUpdate
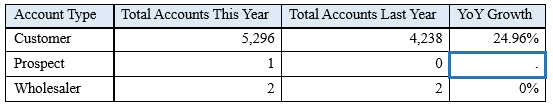
Universal Containers has a dashboard for Sales Managers to visualize the YoY Growth of their customers. The formula used is: YoY = [(This Year – Last Year) / last Year] %
Based on the graphic, when there is no account in the Last Year column, the YoY Growth shows null results. The Sales Managers want to replace it with 100% value.
What is the correct function to use?
Anumber_to_string()
Breplace()
Csubstr()
Dcoalesce()
A company wants to use Einstein Analytics to analyze the trend of their sales pipeline. The company wants to accelerate the sales process. To do so, they need to know the average time an opportunity spends in each stage. This value is not pre-calculated in Salesforce, so a consultant recommends using a dataflow to calculate it.
How can a dataflow be used to calculate the average time an opportunity spends in each stage?
Aflatten Transformation with Offset Expressions to calculate the duration
BcomputeExpression Transformation with SAQL Expression to calculate the duration
CcomputeRelative Transformation with SAQL Expression to calculate the duration
DcomputeRelative Transformation with offset parameter to calculate the duration
A customer displays a lot of data and wants to dynamically emphasize certain values on a bar chart in order to properly grab the user’s attention.
What can an Einstein Consultant use to accomplish this task?
ACustomize tooltip
BCompare Table
CXMD
DChart Markers
A small Business Intelligence team is overwhelmed with multiple requests to create new dashboards. An option is to use layout templates to help with dashboard development.
What are two advantages of using layout templates? (Choose two.)
ALayout templates are equipped with design best practice, such as optimally positioned KPIs and filters
BLayout templates are fast to create because they are fixed and read-only
CLayout templates offer a consistent end user experience
DLayout templates offer a universal layout thus reducing the hours spent on design
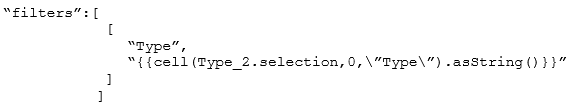
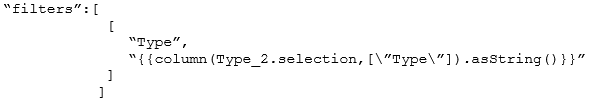
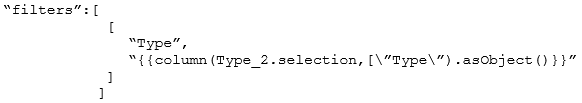
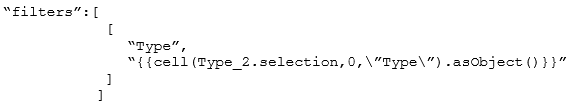
The Universal Containers Einstein Analytics team built a dashboard with two widgets:
1: List widget associated to the step “Type_2” and grouped by the dimension “Type” (multi-selection)
2: Pie chart widget associated to the step “Step_pie_3” and grouped by the dimension “Type”
The team wants to use bindings so any selection in the List widget will filter the Pie chart.
Additional notes:
The steps use different datasets.
Users should be able to choose more than one Type (multi-selection).
What is the right syntax for the binding?
A
B
C
D
A dataset is ready for analysis in Einstein Discovery.
What is the first step a consultant should take after the data is loaded?
ALoad the data into Einstein Analytics
BAnalyze data columns and decide which, if any, to drop
CIdentify data types and define the appropriate data as numeric
DProduce a graph of the data to analyze
A company created a dataset myExternalDataset. It contains a dimension, called UserRegion, that is populated by the standard User object’s picklist: Region.
The company has security requirements for this dataset:
Only a subset of users should be able to access the dataset.
Users who can access the dataset should see only data that belongs to their region.
In which two ways can an Einstein Analytics consultant help them implement these requirements? (Choose two.)
AUse a security predicate in the dataset to users can see only rows belonging to their respective regions.
BSave the dataset under a new application and give “viewer” access to a public group containing the list of users allowed to see the dataset.
CSave the dataset under “My Private App” so only a subset of selected users can access the dataset.
DCreate a sharing rule in Salesforce based on the Region field in the user object and set the dataset to inherit sharing from Salesforce
An Einstein Consultant receives a request from the Marketing department to help them understand lead conversion. Presently, they are unaware of the percentage of leads that get converted to sales. They hope to view results by account manager, value, and quarter. The data is there, so the consultant can add it to the marketing dashboard.
How should this metric be calculated?
ACreate a formula field on the lead object in Salesforce and add it to the dataset
BCreate a new step in the dashboard using a compare table and define a formula
CCreate a computeExpression in the dataflow
DCreate a new step in the dashboard using a compare table and the running total function
A consultant built an Einstein Analytics dashboard for a company. The company then requested an enhancement to the dashboard and provided additional data that needs to be displayed. As a result, the consultant decides to “augment” the dataflow.
Which phrase describes this transformation?
AJoin data similar to an SQL statement
BJoin data based on a many-to-many relationship
CAdd data based on the right-side grain
DAdd data as a lookup relationship (left side is the lowest grain)
An Einstein Analytics team reports that when they start their dataflow it runs successfully with no errors or warnings, but one of the fields does not return values when it is queried.
What can be the origin of this issue?
AThe user who runs the dataflow does not have access to the field
BThe “Security User Profile” does not have access to the field
CThe “Integration User Profile” does not have access to the field
DThe field does not contain any data in Salesforce
A consultant wants to optimize data loads by extracting Salesforce objects using independent Einstein Analytics dataflows ahead of time.
Which construct should be used to accomplish this?
ADataflow
BData Sync (Replication)
CAugment
DClone
Which widget property allows a consultant to restrict the view to a domain bounded by the values entered?
AAdd Custom Range
BAdd Filter
CFilter by Range
DAdd Custom Domain
Which statement best describes how to ensure Einstein Analytics dashboards are easily used across both desktop and mobile devices?
ACreate multiple layouts, and reorder all the widgets so that they fit nicely within the new default width
BCreate a single layout and reorder all the widgets so that they fit nicely when viewing on either device
CCreate a single layout and allow Einstein Analytics to automatically organize dashboard contents to be optimal for the device type
DCreate multiple layouts, ensure the layout selectors match the device, and resize/hide widgets as necessary to ensure the content is appropriate for the device screen size.
The Universal Containers company used Einstein Analytics to create two datasets:
Dataset A: contains a list of activities with an “activityID” dimension and a “userID” dimension
Dataset B: contains a list of users with a “userID” dimension
The team wants to delete from Dataset A all activities related to users in Dataset B.
How can an Einstein Consultant help them achieve this?
AUse an external ETL tool to extract both datasets and delete records
BUse a combination of dataflow transformations: “augment” and “filter”
CUse the recipe operation “delete” and set “userID” as the deletion ID
DUse the dataflow transformation “delete” and set “userID” as the deletion ID