Certified Data Analyst Associate Practice Exam — Free Online Test
QuestionQ1
Understanding of Databricks Data Intelligence Platform
Save question
A data analyst seeks to generate insights from large, complex datasets. The analyst needs to rapidly understand the meaning of different data columns, ask questions in natural language, and get AI-driven recommendations to optimize data queries and workflows.
Which Databricks component is chiefly responsible for enabling these capabilities?
AData Intelligence Engine
BUnity Catalog
CGenie Spaces
DDatabricks Assistant
0
Community Discussion
No comments yet. Be the first to start the discussion!
QuestionQ2
Working with Dashboards and Visualizations in Databricks
0
Community Discussion
No comments yet. Be the first to start the discussion!
QuestionQ3
Executing queries using Databricks SQL and Databricks SQL Warehouses
0
Community Discussion
No comments yet. Be the first to start the discussion!
QuestionQ4
Working with Dashboards and Visualizations in Databricks
0
Community Discussion
No comments yet. Be the first to start the discussion!
QuestionQ6
Securing Data
0
Community Discussion
No comments yet. Be the first to start the discussion!
It's free
100% of the questions are free for all users. No strings attached.
Understanding of Databricks Data Intelligence PlatformManaging DataImporting DataExecuting queries using Databricks SQL and Databricks SQL WarehousesAnalyzing QueriesWorking with Dashboards and Visualizations in DatabricksDeveloping, Sharing, and Maintaining AI/BI Genie spacesData Modeling with Databricks SQLSecuring Data
A BI analyst is creating a Databricks SQL dashboard to monitor monthly revenue for three product categories over two years. Leadership needs a chart that makes it easy to compare each category’s trend over time and rapidly identify seasonal patterns or declines without using extra filters or calculations.
Which Databricks SQL visualization type will clearly convey the described revenue trends and category comparisons?
AMulti-series line chart plotting month on the x-axis and revenue on the y-axis for each category.
BSingle-value counter displaying combined revenue for the entire two-year period.
CPie chart showing each category’s percentage of total revenue for the final month.
DScatter chart with revenue on the x-axis and profit margin on the y-axis for all transactions.
A data analyst executes the following command:
INSERT INTO stakeholders.suppliers TABLE stakeholders.new_suppliers;
What happens when this command is executed?
AThe suppliers table now contains both the data it had before the command was run and the data from the new_suppliers table, and any duplicate data is deleted.
BThe command fails because it is written incorrectly.
CThe suppliers table now contains both the data it had before the command was run and the data from the new_suppliers table, including any duplicate data.
DThe suppliers table now contains the data from the new_suppliers table, and the new_suppliers table now contains the data from the suppliers table.
EThe suppliers table now contains only the data from the new_suppliers table.
A data analyst has created a visualization. A stakeholder reviews it and complains that it is hard to interpret. After reviewing the visualization, the analyst decides that the y-axis scale needs to be changed.
Where in Databricks SQL are the controls to change the y-axis scale located?
AQuery Editor -> Y Axis
BDashboard Editor -> Axes -> Y Axis
CVisualization Editor -> Y Axis
DSettings -> User Settings -> Scaling
A data analyst finds that the developers group has unauthorized access to sensitive data in the Unity Catalog catalog finance_catalog, which should be available only to the finance team.
Which SQL command should the analyst use to remove the developers group’s access to the catalog?
AGRANT USAGE ON CATALOG ‘finance_catalog’ TO ‘finance’;
BALTER CATALOG ‘finance_catalog’ DROP PERMISSIONS FOR ‘developers’;
CREVOKE USAGE ON CATALOG ‘finance_catalog’ FROM ‘developers’;
DREVOKE USE ON CATALOG ‘finance_catalog’ FROM ‘developers’;
QuestionQ7
Executing queries using Databricks SQL and Databricks SQL Warehouses
0
Community Discussion
No comments yet. Be the first to start the discussion!
QuestionQ8
Working with Dashboards and Visualizations in Databricks
QuestionQ10
Working with Dashboards and Visualizations in Databricks
QuestionQ11
Managing Data
QuestionQ12
Working with Dashboards and Visualizations in Databricks
QuestionQ13
Executing queries using Databricks SQL and Databricks SQL Warehouses
QuestionQ14
Data Modeling with Databricks SQL
QuestionQ15
Managing Data
QuestionQ17
Analyzing Queries
QuestionQ18
Analyzing Queries
QuestionQ19
Executing queries using Databricks SQL and Databricks SQL Warehouses
QuestionQ20
Executing queries using Databricks SQL and Databricks SQL Warehouses
QuestionQ21
Developing, Sharing, and Maintaining AI/BI Genie spaces
QuestionQ23
Analyzing Queries
QuestionQ24
Managing Data
QuestionQ25
Managing Data
QuestionQ26
Data Modeling with Databricks SQL
QuestionQ27
Developing, Sharing, and Maintaining AI/BI Genie spaces
QuestionQ28
Developing, Sharing, and Maintaining AI/BI Genie spaces
QuestionQ29
Working with Dashboards and Visualizations in Databricks
Save question
0
Community Discussion
No comments yet. Be the first to start the discussion!
Save question
0
Community Discussion
No comments yet. Be the first to start the discussion!
Save question
0
Community Discussion
No comments yet. Be the first to start the discussion!
Save question
0
Community Discussion
No comments yet. Be the first to start the discussion!
Save question
0
Community Discussion
No comments yet. Be the first to start the discussion!
Save question
0
Community Discussion
No comments yet. Be the first to start the discussion!
Save question
0
Community Discussion
No comments yet. Be the first to start the discussion!
Ad
Want a break from the ads?
Go ad-free and unlock Learn Mode, Exam Mode, AstroTutor AI and every premium tool — everything you need to walk in prepared, and confident.
No comments yet. Be the first to start the discussion!
Save question
0
Community Discussion
No comments yet. Be the first to start the discussion!
Save question
0
Community Discussion
No comments yet. Be the first to start the discussion!
Save question
0
Community Discussion
No comments yet. Be the first to start the discussion!
Save question
0
Community Discussion
No comments yet. Be the first to start the discussion!
Save question
0
Community Discussion
No comments yet. Be the first to start the discussion!
Save question
0
Community Discussion
No comments yet. Be the first to start the discussion!
Save question
0
Community Discussion
No comments yet. Be the first to start the discussion!
Save question
0
Community Discussion
No comments yet. Be the first to start the discussion!
Save question
0
Community Discussion
No comments yet. Be the first to start the discussion!
Save question
0
Community Discussion
No comments yet. Be the first to start the discussion!
Save question
0
Community Discussion
No comments yet. Be the first to start the discussion!
Which resource is used for compute in Databricks SQL?
AStandard clusters
BSingle-node clusters
CSQL warehouses
DDownstream BI tools integrated with Databricks SQL
A data analyst is examining user-engagement trends and wants to create a visualization while working interactively in a Databricks notebook. The analyst runs a SQL query with %sql and wants to convert its result into a line chart that shows weekly user counts over time.
Which step lets the analyst create the chart directly in the notebook?
ASave the query as a table, export it to Excel, and use Excel’s charting tools.
BWrap the SQL query in a Python plotly.express call using %python.
CUse %sql to run the query, then copy the result into a new dashboard to access visualization options.
DUse the display() function or %sql to run the query, then click the + icon in the result cell to add a visualization.
A data analyst has created and saved a set of queries that expose trends requiring monitoring by several stakeholders.
Which tool should the data analyst use to share the results from all the queries so they can be viewed together at once?
AA SQL warehouse (formerly known as a SQL endpoint)
BA Query History page
CA dashboard
DA data visualization tab on a Query page
Which of the following is a benefit of using a Delta Lake-based data lakehouse instead of common data lake solutions?
AACID transactions
BFlexible schemas
CData deletion
DScalable storage
EOpen-source formats
A data analyst wants to build a dashboard with three primary sections: Development, Testing, and Production. They want all three sections on the same dashboard, while clearly identifying each section with text on the dashboard.
Which tool can the data analyst use to label the Development, Testing, and Production sections with text?
ASeparate endpoints for each section
BSeparate queries for each section
CMarkdown-based text boxes
DDirect text written into the dashboard in editing mode
ESeparate color palettes for each section
What is one advantage of using Databricks SQL for business intelligence (BI) analytics projects rather than third-party BI tools?
AComputations, data, and analytical tools on the same platform
BAdvanced dashboarding capabilities
CSimultaneous multi-user support
DAutomated alerting systems
A data architect has told a data analyst team that its organization will now adopt a data design pattern that logically organizes data in a lakehouse, aiming to incrementally and progressively improve data structure and quality as it moves through each architectural layer.
Which term describes this data design pattern?
AMedallion architecture
BChange data feed
CDelta Lake
DData mesh
A data analyst is using gold-layer tables to finish an ad-hoc project. A stakeholder has given the analyst an additional dataset that can augment the gold-layer tables already being used.
Which term describes this data augmentation?
AData testing
BAd-hoc improvements
CLast-mile dashboarding
DLast-mile ETL
EData enhancement
A data scientist asks a data analyst to create histograms for each continuous variable in a data set. The data analyst must determine which data-set columns are continuous.
What defines a continuous variable?
AA quantitative variable that never stops changing
BA quantitative variable that can take on a finite or countably infinite set of values
CA quantitative variable that can take on an uncountable set of values
DA categorical variable in which the number of categories continues to increase over time
A data analyst needs to identify product categories that satisfy two conditions:
Each category has more than 10 products.
The category’s average product price exceeds $50.
Which SQL statement uses aggregate functions to return only the categories that meet these conditions?
ASELECT category, COUNT() FROM products GROUP BY category HAVING COUNT() > 10 AND AVG(price) > 50;
BSELECT category, COUNT() FROM products WHERE COUNT() > 10 GROUP BY category HAVING AVG(price) > 50;
CSELECT category, COUNT() FROM products HAVING COUNT() > 10 GROUP BY category WHERE AVG(price) > 50;
DSELECT category, COUNT() FROM products GROUP BY category WHERE COUNT() > 10 AND AVG(price) > 50;
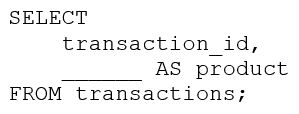
A data engineer is working with a nested array column, products, in the transactions table. They need to expand the table so that every unique item in products for each row gets its own row, with the transaction_id column repeated as required.
They are using the following incomplete command:
Which of the following lines of code can they use to fill in the blank in the code block above so that it successfully accomplishes the task?
Aarray distinct(products)
Bexplode(products)
Creduce(products)
Darray(products)
Eflatten(products)
A data analyst must use the Databricks Lakehouse Platform to rapidly create SQL queries and data visualizations. The platform's compute resources must be able to run serverlessly, and data visualizations are expected to be included in a dashboard.
Which Databricks Lakehouse Platform service or capability satisfies all these requirements?
ADelta Lake
BDatabricks Notebooks
CTableau
DDatabricks Machine Learning
EDatabricks SQL
A BI analyst has built a Genie space containing customer sales data and must share it with external stakeholders who are not members of the workspace. The stakeholders need to ask questions about the data but must not be given access to the underlying Databricks workspace or compute resources.
How should the BI analyst share the Genie space with the external stakeholders?
AShare the Genie space with embedded credentials and assign the stakeholders as account users with published dashboard access.
BExport the Genie space data to CSV files and share via email with instructions to upload to their own Databricks workspace.
CCreate individual workspace accounts for each stakeholder and assign Databricks SQL access entitlement with CAN RUN permissions.
DGrant the stakeholders workspace membership with Consumer access entitlement and CAN VIEW permissions on the Genie space.
A data analyst is troubleshooting a Databricks SQL query that fails while processing large datasets and complex join operations. Logs show that the job repeatedly aborts because of cluster resource-constraint errors.
Which Query Profile metric should the analyst use to find the operator causing the resource overuse?
ATime spent per operator
BShuffle read size per operator
CMemory peak per operator
DBytes spilled to disk per operator
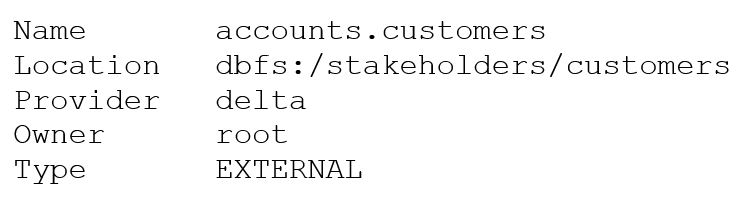
After executing DESCRIBE EXTENDED accounts.customers;, the following output is returned:
A data analyst now runs this command:
DROP accounts.customers;
Which of the following describes the outcome of running this command?
ARunning SELECT * FROM delta. dbfs:/stakeholders/customers results in an error.
BRunning SELECT * FROM accounts.customers will return all rows in the table.
CAll files with the .customers extension are deleted.
DThe accounts.customers table is removed from the metastore, and the underlying data files are deleted.
EThe accounts.customers table is removed from the metastore, but the underlying data files are untouched.
A data analyst works with a Unity Catalog table called sales_data that stores customer order information. The order_quantity column is defined as an INTEGER, but it sometimes contains -1 values that indicate a data-entry error. To enable accurate reporting, the analyst must create a new view named clean_sales_data that omits these erroneous rows.
Which SQL query creates the clean_sales_data view while filtering out records whose order_quantity is -1?
ACREATE VIEW clean_sales_data AS SELECT * FROM sales_data WHERE order_quantity IS NOT NULL AND order_quantity > 0;
BCREATE VIEW clean_sales_data AS SELECT * FROM sales_data WHERE ABS(order_quantity) != 1;
CCREATE VIEW clean_sales_data AS SELECT * FROM sales_data HAVING order_quantity != -1;
DCREATE VIEW clean_sales_data AS SELECT * FROM sales_data WHERE order_quantity != -1;
A data analyst created a user-defined function with the following code:
CREATE FUNCTION price(spend DOUBLE, units DOUBLE)

RETURNS DOUBLE -
RETURN spend / units;
Which of the following code blocks can apply this function to the customer_spend and customer_units columns in the customer_summary table to create the customer_price column?
ASELECT PRICE customer_spend, customer_units AS customer_priceFROM customer_summary
BSELECT price -FROM customer_summary
CSELECT function(price(customer_spend, customer_units)) AS customer_priceFROM customer_summary
DSELECT double(price(customer_spend, customer_units)) AS customer_priceFROM customer_summary
ESELECT price(customer_spend, customer_units) AS customer_priceFROM customer_summary
A data analyst is curating a Genie space for the marketing team to explore campaign-performance data. To support accurate, context-aware responses, the analyst includes curated Unity Catalog tables, writes clear domain instructions, and adds sample questions.
What additional action can the analyst take to maximize trust and reuse for frequently asked queries?
ADisable the use of domain instructions to prevent bias in AI-generated answers.
BMark commonly used queries as Trusted Assets after verifying their correctness.
CEnable automatic query generation so users receive instant responses without review.
DAllow users to edit the underlying datasets to improve Genie responses.
A data analyst is setting up a Genie space to support natural-language questions about product sales, including fields such as region_code, sku, and channel_type. The analyst finds that Genie frequently produces ambiguous or incorrect queries because the column meanings are unclear.
Which two actions will help improve Genie’s accuracy and relevance when it interprets user questions?
Choose two
AProvide sample values for ambiguous columns to help Genie infer the data’s meaning and usage.
BWrite domain-specific instructions that describe how terms like region and channel relate to the business.
CAdd more columns from the underlying tables to give Genie access to a broader set of data points for reasoning.
DAdd descriptions to columns using Unity Catalog so Genie can use them as context during query generation.
EInclude example queries that reflect how business users refer to the data in everyday language.
A data analyst has opened the SQL Editor page and written a new SQL statement. The data analyst now wants to save the statement so it can be easily referenced later and added to a dashboard. The SQL statement's results must be displayable as a counter, table, or data visualization.
Which approach should the data analyst use to complete this task?

Community Discussion