QuestionQ23
VerifiedBusiness CapabilitiesConsider the following business capability map, in which model cells use different colors to indicate maturity levels (the letters G, R, Y, and P also identify the colors Green, Red, Yellow, and Purple):
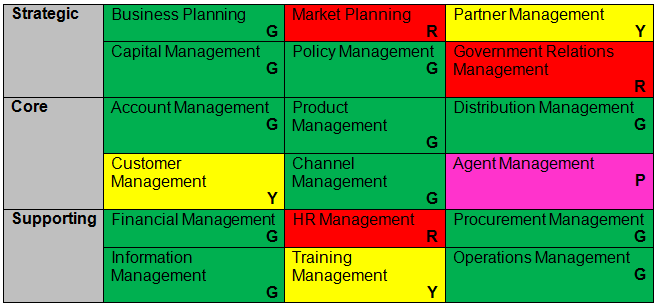
Which option best describes this technique?
Community Discussion