Certified Tableau Data Analyst Practice Exam — Free Online Test
QuestionQ1
Create Content
Save question
A Data Analyst must add a custom color palette to Tableau Desktop for use across multiple workbooks. The palette must align with the company’s branding.
What should the analyst do?
ASelect Clear Worksheet Formatting from the Format menu for the worksheet. From the color picker, select Shading, and then select the colors.
BSelect the colors from the color picker and click Add to Custom Colors.
CModify the MXL tags in the Preferences.tps file in My Tableau Repository.
DCreate new shapes for the colors of the custom color palette and copy the shapes to the Shapes folder in My Tableau Repository.
0
Community Discussion
No comments yet. Be the first to start the discussion!
QuestionQ2
Explore and Analyze Data
0
Community Discussion
No comments yet. Be the first to start the discussion!
QuestionQ3
Connect to and Transform Data
0
Community Discussion
No comments yet. Be the first to start the discussion!
QuestionQ5
Create Content
0
Community Discussion
No comments yet. Be the first to start the discussion!
QuestionQ6
Publish and Manage Content on Tableau Server and Tableau Cloud
0
Community Discussion
No comments yet. Be the first to start the discussion!
It's free
100% of the questions are free for all users. No strings attached.
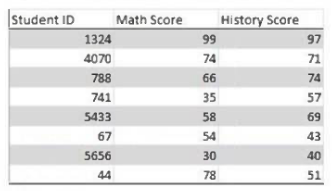
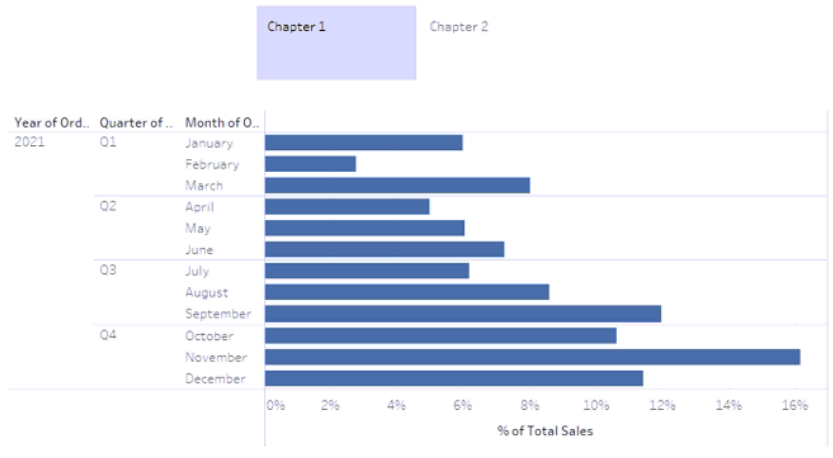
The analyst needs to analyze the relationship between math scores and history scores, as shown in the following exhibit.
Which three actions should the analyst take?
Choose three
ADrag in a Trend Line from the Analytics Pane.
BAdd History Score and Math Score to the Marks card.
CDrag Student ID to Detail on the Marks card.
DRight-click the y axis, and then select Add Reference Line.
EAdd Math Score to the Rows shelf and History Score to the Columns shelf.
A Data Analyst receives the following table and is asked to create a flow that produces a date field in the data. This field must update automatically as new dates are added to the original table.
Which technique should the analyst use as the first step to accomplish this in Tableau Prep?
AA wildcard search to pivot in the Pivot step
BA Rows to Columns Pivot step
CAn Aggregate step to reshape the data
DA wildcard search for multiple tables in the Input step
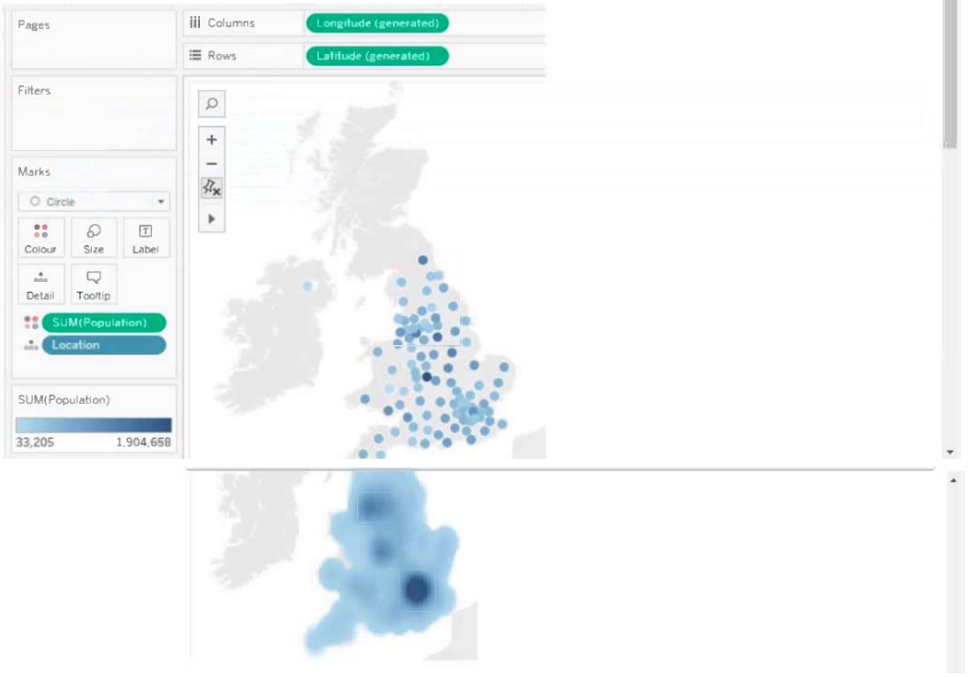
A Data Analyst has created the map shown below.
What should the analyst do?
ADrag Population to Size on the Marks card/
BChange the mark type to Map.
CDrag Location to Size on the Marks card.
DChange the mark type to Density.
EChange the opacity to 75%.
What is needed to publish a data source from Tableau Desktop to Tableau Server or Tableau Cloud?
AAdministrator permission on the server
BView permission on the project
CCreator site role
DA Tableau Public account
QuestionQ7
Create Content
0
Community Discussion
No comments yet. Be the first to start the discussion!
QuestionQ8
Connect to and Transform Data
QuestionQ9
Explore and Analyze Data
QuestionQ10
Connect to and Transform Data
QuestionQ11
Explore and Analyze Data
QuestionQ12
Explore and Analyze Data
QuestionQ13
Create Content
QuestionQ14
Connect to and Transform Data
QuestionQ15
Connect to and Transform Data
QuestionQ16
Connect to and Transform Data
QuestionQ17
Explore and Analyze Data
QuestionQ18
Explore and Analyze Data
QuestionQ19
Connect to and Transform Data
QuestionQ20
Publish and Manage Content on Tableau Server and Tableau Cloud
QuestionQ21
Explore and Analyze Data
QuestionQ22
Create Content
QuestionQ23
Explore and Analyze Data
QuestionQ24
Connect to and Transform Data
QuestionQ25
Create Content
QuestionQ26
Create Content
Save question
0
Community Discussion
No comments yet. Be the first to start the discussion!
Save question
0
Community Discussion
No comments yet. Be the first to start the discussion!
Save question
0
Community Discussion
No comments yet. Be the first to start the discussion!
Save question
0
Community Discussion
No comments yet. Be the first to start the discussion!
Save question
0
Community Discussion
No comments yet. Be the first to start the discussion!
Save question
0
Community Discussion
No comments yet. Be the first to start the discussion!
Save question
0
Community Discussion
No comments yet. Be the first to start the discussion!
Ad
Want a break from the ads?
Go ad-free and unlock Learn Mode, Exam Mode, AstroTutor AI and every premium tool — everything you need to walk in prepared, and confident.
No comments yet. Be the first to start the discussion!
Save question
0
Community Discussion
No comments yet. Be the first to start the discussion!
Save question
0
Community Discussion
No comments yet. Be the first to start the discussion!
Save question
0
Community Discussion
No comments yet. Be the first to start the discussion!
Save question
0
Community Discussion
No comments yet. Be the first to start the discussion!
Save question
0
Community Discussion
No comments yet. Be the first to start the discussion!
Save question
0
Community Discussion
No comments yet. Be the first to start the discussion!
Save question
0
Community Discussion
No comments yet. Be the first to start the discussion!
Save question
0
Community Discussion
No comments yet. Be the first to start the discussion!
Save question
0
Community Discussion
No comments yet. Be the first to start the discussion!
Save question
0
Community Discussion
No comments yet. Be the first to start the discussion!
Save question
0
Community Discussion
No comments yet. Be the first to start the discussion!
A Data Analyst creates the following story, which contains two story points.
The analyst needs to change the story point format so it displays the current story point number out of the total number of story points.
Which Layout option should the analyst use?
ACaption boxes
BArrows only
CDots
DNumbers
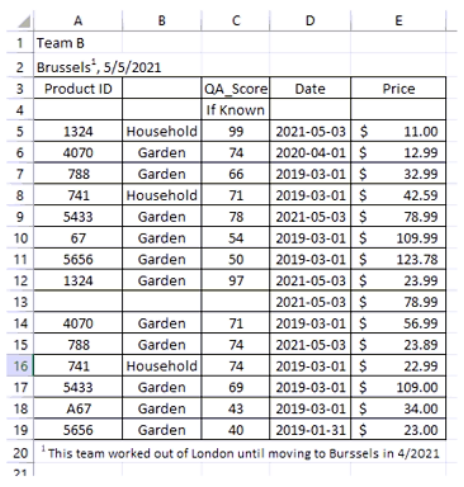
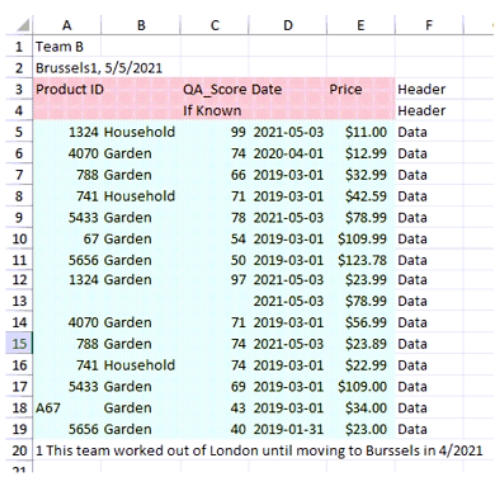
A Data Analyst has the following dataset in Microsoft Excel.
The analyst uses Data Interpreter to cleanse the dataset. Data Interpreter produces the following results.
How many data rows will Tableau ingest as values?
A19
B15
C20
D17
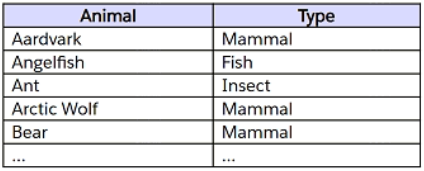
A Data Analyst has a large data source containing more than 10 million rows. Users can filter rows by a field named Animal.
The following is a sample of the data.
The analyst wants to ensure every calculation is affected by including only animals of a specific type.
Which filter type should the analyst create on the worksheet?
ATable calculation
BMeasure
CExtract
DContext
A Data Analyst wants to connect a Tableau workbook to a dataset stored in a Microsoft Excel spreadsheet. What action should the analyst take from Tableau Desktop to accomplish this?
ASelect New Data Source from the Data menu.
BSelect New from the File menu.
CSelect Replace Data Source from the Data menu.
DSelect Import Workbook from the File menu.
A Data Analyst must analyze the sales team’s financial performance. To make the dashboards easier to interpret, the analyst needs to format financial values so the dollar symbol (S) appears before each value.
How should the analyst enable this formatting throughout the workbook?
ARight-click on the measure in the data pane, then click on Default Properties and Number Format.
BClick on the Analysis tab and select Forecast.
CRight-click on the measure in the data pane, then click on Create and Calculated Field to convert to a string and add the $ symbol.
DClick on the Format tab and select Workbook Theme.
What should a Data Analyst use to visualize the distribution and variation of measure values along an axis?
ABox Plot
BScatter Plot
CBullet Graph
DHistogram
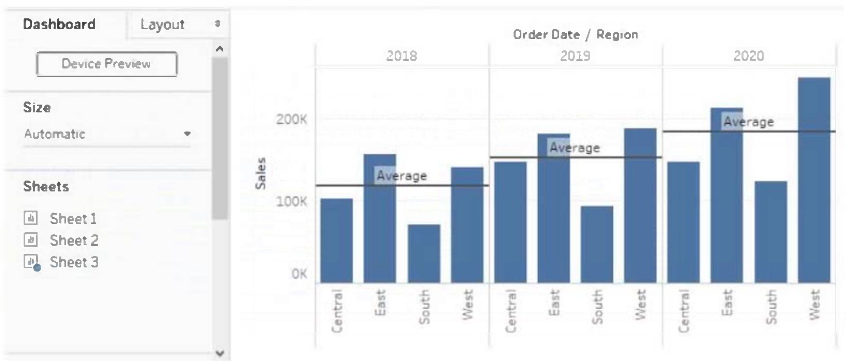
A Data Analyst has the following tiles dashboard, which contains one sheet named Sheet 3.
The analyst wants to replace that sheet with Sheet 2. What should the analyst do?
AA Right-click Sheet 2 and select Add to Dashboard.
BSelect Remove Dashboard Item from the context menu of Sheet 3.
CSelect Sheet 3 on the dashboard and click the Swap Sheet button next to Sheet 2.
DSelect Deselect from the context menu of Sheet 3.
A Data Analyst has been asked to provide a dashboard concerning employee time logs. Employees enter their time on mobile devices throughout the day, and the data is stored in a cloud-based database. End users want dashboard data as close to real time as possible.
How should the analyst best create a data source that meets these requirements?
ACreate a connection to the database to retrieve the data using Tableau Bridge. Schedule the refresh of the data extract to 15 minutes.
BCreate a connection to the database using Tableau Desktop and retrieve an extract of the data. Publish the data source from Tableau Desktop to Tableau Cloud and schedule the refresh of the extract.
CCreate a connection to the database using Tableau Desktop. Publish the data source to Tableau Cloud using a live connection and disable any firewalls on the database.
DCreate a connection to the database using Tableau Desktop. Publish the data source to Tableau Cloud using a live connection, ensuring the database firewall has been configured to allow connections from Tableau Cloud.
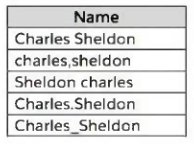
A Data Analyst has the following dataset:
Which grouping option should the analyst use in Tableau Prep to automatically group all five names together?
APronunciation
BSpelling
CCommon Characters
DManual Selection
A Data Analyst has created a Tableau Prep flow that is ready for use. A colleague will use the output to build a dashboard on Tableau Cloud or Tableau Server.
Where should the analyst output the data?
ASalesforce Data Cloud
BA published data source
CCRM Analytics
DA Tableau data extract file
Which syntax should a Data Analyst use to determine the first purchase date for each customer when customer is not in the view?
A[Customer ID] : ( [Purchase Date])
BMIN ( [Purchase Date])
C{ FIXED [Customer ID] : MIN( [Purchase Date]) }
D{ [Customer ID] : MIN( [Purchase Date]) }
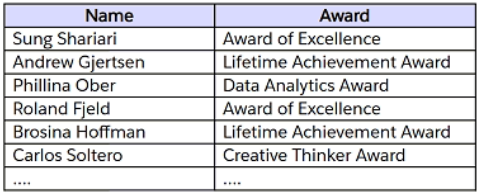
A Data Analyst has a dataset containing people and the awards they have received.
Which formula should the analyst use to determine the number of distinct award types that have been received?
ACOUNTD([NAME])
BCOUNTD([Award])
CCOUNT([Award])
DWINDOW_COUNT([Award])
What capability does a Web Data Connector give to a Data Analyst?
AScrape data from an HTML table.
BPublish data to the company website.
CCapture website traffic.
DConnect to an API.
How should a Data Analyst apply row-level security to ensure secure access to a published data source for viewers and explorers?
ASet up Data Source permissions.
BLeverage User Filters in the dimension filter.
CSet up a separate dashboard for each department.
DLeverage User Filters in the data source filter.
What is a good scenario for applying a Gantt chart within Tableau?
A. To analyze correlation between project resourcing and quality
B. To compare performance of a project across different regions
C. To analyze trends of budget growth in a project over multiple quarters
D. To display the timeline of project tasks and their durations
ATo analyze correlation between project resourcing and quality
BTo compare performance of a project across different regions
CTo analyze trends of budget growth in a project over multiple quarters
DTo display the timeline of project tasks and their durations
A Data Analyst is building a map with several data layers at the country, state, and city levels. Users want to customize the map by switching layers on and off as needed.
How should the analyst provide this functionality?
AEnable the Layer Control in the Map Options.
BAdd a parameter to toggle layer visibility.
CUse the Filter shelf to allow users to filter layers.
DUse dual-axis maps to overlay different layers.
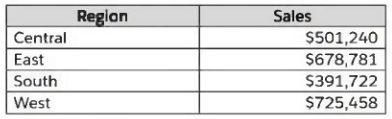
A Data Analyst has the following dataset:
Which Level of Detail (LOD) expression should the analyst use to calculate the grand total across all regions?
A{ FIXED : TOTAL(Sales) }
B{ FIXED : SUM(Sales) }
C{ FIXED [Region]: TOTAL(Sales) }
D{ FIXED [Region]: SUM(Sales) }
At which step in Tableau Prep Builder can a Data Analyst create a single item based on a matching pattern across multiple file names?
AA New Rows
BInput
CUnion
DJoin
A Data Analyst needs to modify the values displayed for a dimension without creating a new field.
What should the analyst do?
ATransform the fields
BCreate aliases
CRename the fields
DCreate groups
When a Show/Hide button is used in Tableau, what occurs if the object is placed in a Tiled layout container?
AThe layout automatically adjusts to fill the space.
BThe hidden object remains in the same position but is grayed out.
Community Discussion