Certified Tableau Consultant Practice Exam — Free Online Test
QuestionQ1
Design and Troubleshoot Calculations and Workbooks
Save question
A client needs to give a user access to a data source hosted on Tableau Server so the user can create new content in Tableau Desktop. However, the user must be limited to viewing only an approved subset of the data.
How should the client configure the filter before publishing the Hyper file so that the Desktop user adheres to the same row-level security (RLS) as viewers of the finished content?
AContext Filter
BData Source Filter
CApply Filter to All Using Related Data Sources
DExtract Filter
0
Community Discussion
No comments yet. Be the first to start the discussion!
QuestionQ2
Design and Troubleshoot Calculations and Workbooks
0
Community Discussion
No comments yet. Be the first to start the discussion!
QuestionQ3
Establish Governance and Support Published Content
0
Community Discussion
No comments yet. Be the first to start the discussion!
QuestionQ4
Plan and Prepare Data Connections
0
Community Discussion
No comments yet. Be the first to start the discussion!
QuestionQ5
Design and Troubleshoot Calculations and Workbooks
0
Community Discussion
No comments yet. Be the first to start the discussion!
It's free
100% of the questions are free for all users. No strings attached.
Evaluate Current StatePlan and Prepare Data ConnectionsDesign and Troubleshoot Calculations and WorkbooksEstablish Governance and Support Published Content
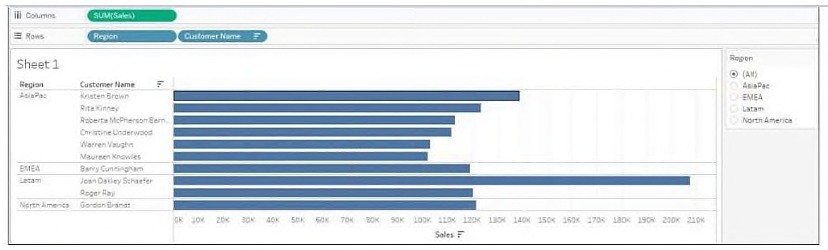
A business analyst is building a view of the top 10 customers in each region. The analyst applied a “Top 10” filter to Customer Name, but it did not show the top 10 customers per region, as illustrated below.
Which filter type should the business analyst add to filter by region?
AExtract filter
BContext filter
CTable Calculation filter
DDimension filter
A company’s Tableau Cloud administrator wants to retain control over the content published to its site for viewers while still enabling self-service for dashboard creators.
Which governance strategy should the administrator use?
AMaintain a separate sandbox site and use the Content Migration Tool to promote content between sites.
BRestrict users’ permission to view data sources used in uncertified dashboards.
CAllow dashboard creators to publish to their Personal Space and for site administrators to move content to projects.
DCreate sandbox projects to contain ad hoc content and production projects for validated content.
A consultant is planning a Tableau deployment for a client that uses Salesforce. The client wants users to automatically view Tableau regional-sales visualizations filtered by customer immediately after they sign in to Salesforce.
Which approach should the consultant use to provide the final visualization?
APublish to Tableau Mobile for viewing.
BCreate a list of URLs that the users can click in Salesforce.
CCreate subscriptions for each view to deliver reports by email.
DEmbed views into Salesforce.
A client has a sales dataset containing fields named Customer ID, Region, Item, and Sales Amount. Every row represents one sale, and there can be multiple sales for each Customer ID.
The client wants to visualize the average total sales per customer by region.
Which Level of Detail (LOD) expression should a consultant recommend?
No comments yet. Be the first to start the discussion!
Save question
0
Community Discussion
No comments yet. Be the first to start the discussion!
Save question
0
Community Discussion
No comments yet. Be the first to start the discussion!
Save question
0
Community Discussion
No comments yet. Be the first to start the discussion!
Save question
0
Community Discussion
No comments yet. Be the first to start the discussion!
Save question
0
Community Discussion
No comments yet. Be the first to start the discussion!
Save question
0
Community Discussion
No comments yet. Be the first to start the discussion!
Save question
0
Community Discussion
No comments yet. Be the first to start the discussion!
Save question
0
Community Discussion
No comments yet. Be the first to start the discussion!
Save question
0
Community Discussion
No comments yet. Be the first to start the discussion!
Save question
0
Community Discussion
No comments yet. Be the first to start the discussion!
Save question
0
Community Discussion
No comments yet. Be the first to start the discussion!
A client has a data source that records a timestamp every time a user interacts with a product feature. They visualize 3 years of data at the daily level. As adoption has increased during the past 6 months, dashboard performance has progressively declined, even though the connection uses a data extract refreshed every hour.
A Tableau consultant needs to improve dashboard performance with the least effect on the visualization.
Which option meets these requirements without additional cost?
AInvest in an extract, transform, load (ETL) tool to aggregate the data to a daily level.
BLeverage Tableau Prep to aggregate the data to the daily product level.
CDecrease the extract refresh to once a day.
DAdd extract filters to limit the number of product features visualized.
A Tableau Cloud client wants a custom dashboard that tracks which data sources are used most often in dashboards throughout their site.
Which two actions should the client take to access the required metadata?
Choose two
AQuery metadata through the GraphiQL engine.
BDownload metadata through Tableau Catalog.
CAccess metadata through the Metadata API.
DConnect directly to the Site Content data source within the Admin Insights project.
A consultant aims to enhance report performance by shifting calculations to the data layer and materializing them in the extract.
Which type of calculation can the consultant move?
AA calculation that contains an aggregation
BA calculation that contains table calculation functions
CA row-level calculation
DA calculation that contains parameters
A client has numerous published data sources in Tableau Server. The data sources use the same databases and tables. The client observes that different departments get different answers to the same business questions, and the departments cannot trust the data. The client wants to determine what causes the data sources to return different data.
Which tool should the client use to identify this issue?
ATableau Resource Monitoring Tool
BTableau Prep Conductor
CTableau Catalog
DTableau Agent
A client’s dashboard contains two sections for its shops and warehouses, which are displayed when a viewer selects either shops or warehouses using a parameter. Several quick filters apply to both sections, whereas others apply only to shops or only to warehouses.
Currently, all quick filters appear on the left side of the dashboard. The client wants to hide every filter but, when displayed, make it easy for viewers to locate the quick filters that apply only to shops or only to warehouses.
Which solution should the consultant recommend to meet the client’s needs in the most user-friendly way?
AUse Dynamic Zone Visibility to inform viewers which quick filters apply to warehouses or shops.
BUse Dynamic Zone Visibility to show only the quick filters that apply with the chosen parameter value and a Show/Hide Button to hide the container with all the filters.
CDivide the quick filters into three groups: General, for shops, for warehouses; place the general filters on the left of the dashboard for warehouses; place other filters next to the sections to which they apply.
DHide the container with all quick filters with a Show/Hide Button.
A worksheet uses a LOOKUP function to show Sales by Month, Year of Order Date, and sales for the most recent 12 months. A consultant wants to apply a Relative Date filter for data from the last 12 months. However, applying it removes the previous year’s data from the worksheet.
Which two actions should the consultant take to preserve the prior year’s data after applying the filter?
Choose two
ASet the Relative Date filter as a Context Filter instead of Measure Filter.
BCreate the following calculation: DATEDIFF(‘month’,[Order Date],(MAX([Order Date])})<12. Hide all False values.
CCreate the following calculation: LOOKUP(MIN([Order Date]),0). Filter on that calculation instead of Order Date.
DReplace the LOOKUP function with a FIXED Level of Detail (LOD) expression.
A customer has migrated from Tableau Server to Tableau Cloud, but private-network data remains behind the corporate firewall and must be accessed securely by Tableau Cloud.
Which data-connection strategy should a Tableau consultant recommend to minimize customer software maintenance?
APrivate Connect
BTableau Bridge
CDirect Connect
DData Connect
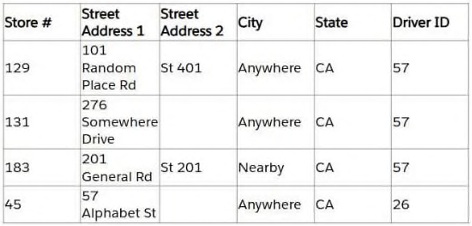
A client wants to see the stores serviced by delivery drivers on a map. They have the information shown in the following table.
What must the client do to plot the precise street addresses on the map?
AEstablish a hierarchy of State > City > Street Address 1 > Street Address 2.
BCustom geocode the street addresses.
CChange the data type of Street Address 1 and Street Address 2 to the Geographic role.
DAdd a Map layer to the visualization.
A consultant is building a dashboard that reports hourly sales data. The data must refresh every hour and supports time-sensitive decision-making, so dashboard viewers must be alerted when the data has not refreshed.
Which Tableau Catalog feature should the consultant use to ensure dashboard viewers recognize this message?
ACertified Data Source
BHigh Visibility Data Quality Warning
CLineage
DStandard Visibility Data Quality Warning
A client needs to count every distinct order placed in 2010. They wrote the following calculation, but it produces an error:
IF YEAR([Date]) = 2010 THEN COUNTD([OrderID]) END
Which calculation would return the correct result?
ACOUNTD(IF YEAR([Date])=2010 THEN [OrderID] END)
BCOUNT(IF YEAR([Date])=2010 THEN [OrderID] END)
CIF MIN(YEAR([Date]))=2010 THEN WINDOW_COUNTD([OrderID]) END
DIF YEAR([Date])=2010 THEN {COUNTD ([OrderID])} END
A workbook that uses a data-source extract is taking a long time to load. Tableau’s Performance Optimizer reports several necessary calculations that reference other calculations.
Which two solutions should resolve this warning and improve performance?
Choose two
AChoose the “Compute Calculations Now” option when publishing the data source.
BAdd “Apply” to the filters in the workbook.
CHide the nested calculations when publishing the workbook.
DBuild the calculations into the data source upstream of Tableau.
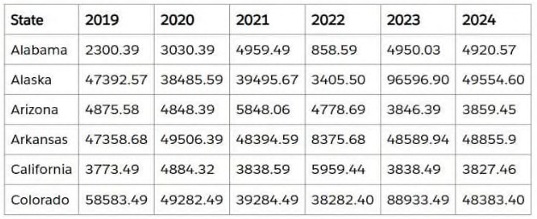
A Tableau consultant who is evaluating a data structure is given the sample dataset below.
Which two statements about the dataset are true?
Choose two
AThe data can be pivoted in order to enable a year selector.
BThe names of the columns are accurate and indicate what the data values actually mean.
CThe data needs to be denormalized before it can be used.
DThe data structure will require a lot of maintenance, as maintenance will need to be done to handle a new column for a new year.
A database has two related tables at distinct levels of granularity. The client wants all data to be available in Tableau Prep at its original level of granularity.
Which two Tableau solutions meet the client’s requirements?
Choose two
ATwo separate Published Data Sources, one for each table
BA virtual connection to the database and both tables within it
CA single Published Data Source with a physical join between the two tables
DA single Published Data Source with a Relationship between the two tables
During a Tableau Cloud implementation, a Tableau consultant is assigned to implement row-level security (RLS). RLS has already been implemented in the client’s own database for its legacy reporting solution. The client asks whether it can use that existing RLS after implementing Tableau Cloud.
Which two requirements should the Tableau consultant communicate to the client?
Choose two
ABoth live and extract connections can be used.
BOnly live data connections can be used.
CThe RLS in database option must be configured in Tableau Cloud.
DThe Tableau Cloud username must exist in the database.
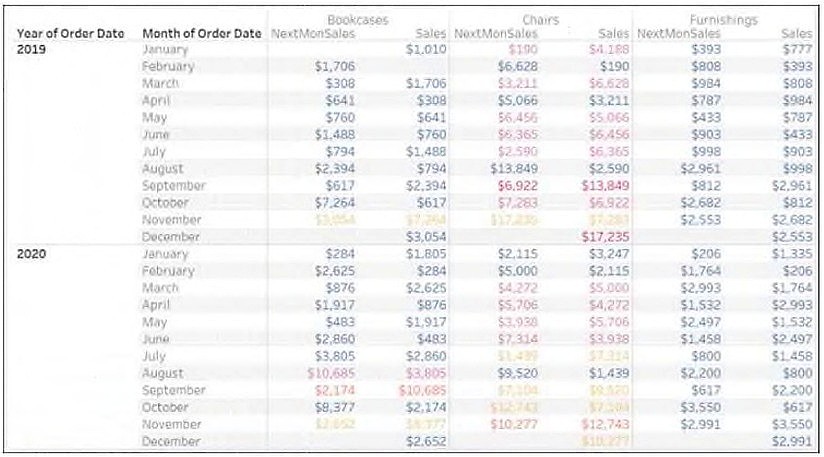
A client wants to readily identify revenue variations for each subcategory in the table below. A consultant must create a field that displays the following month’s sales independently for every month in the years 2019 and 2020. The client wants the results to match the following table.
Which calculation should the consultant use to achieve the desired result?
ALOOKUP(SUM([Sales]),LAST()+1)
BLOOKUP(SUM([Sales]),1)Compute Using: Pane -Direction: Down
CLOOKUP(SUM([Sales]),1)Compute Using: Pane -Direction: Across
DLOOKUP(SUM([Sales]),FIRST()+l)
Which technique should a Tableau consultant use to improve visualization speed?
AUse COUNTD to aggregate data as much as possible.
BInclude more sheets to increase rendering speed.
CRemove any unneeded dimensions from the Detail shelf.
DUse Show Relevant Values on any filters.
A university has undergraduate-student data showing majors at each grade level (Freshman, Sophomore, Junior, Senior). The university wants to visualize the paths students follow as they switch majors across grade levels.
Which visualization type should the consultant recommend?
ARadar chart
BSankey diagram
CTree chart
DChord chart
A consultant is assisting a Tableau Server customer. The customer asks whether they need to upgrade their Tableau Server instance, which was installed more than 1 year ago.
Which two circumstances warrant an upgrade?
Choose two
AUsers are complaining of performance; the upgrade will reduce the server’s hardware requirements
BThe need to access new features and improvements from Tableau Cloud
CThe security team has a report of bugs and security vulnerabilities in older versions of Tableau
DCompatibility with newer Tableau Desktop and Prep Builder versions that users might want to install
How does View Acceleration enhance performance?
ABy improving the performance of views that contain long-running queries with transient functions
BBy precomputing and fetching workbook data in a background process
CBy enhancing the rendering speed of visuals, such as drawing shapes and maps
DBy optimizing the performance of views built only on extract-based data sources
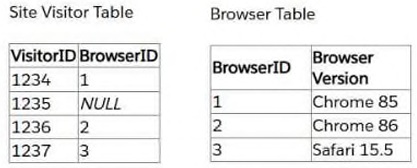
A client gathers information about the web browsers customers use to visit its website and visualizes the distribution of web traffic by browser version. The data is stored in the related-table format shown below, with a NULL BrowserID in the Site Visitor Table when an unknown browser version visits the website.
The client uses Some Records Match for the Referential Integrity setting because a match is not assured. The client wants to improve dashboard performance while still obtaining an accurate count of site visitors.
Which changes to the data tables and join should the consultant recommend?
AAdd an “Unknown” option to the Browser Table, reference its BrowserID in the Site Visitor Table, and leave the Referential Integrity set to “Some Records Match”.
BContinue to use NULL as the BrowserID in the Site Visitor Table and leave the Referential Integrity set to “Some Records Match”.
CContinue to use NULL as the BrowserID in the Site Visitor Table and change the Referential Integrity to “All Records Match”.
DAdd an “Unknown” option to the Browser Table, reference its BrowserID in the Site Visitor Table, and change the Referential Integrity to “All Records Match”.

Community Discussion