PL-300: Microsoft Power BI Data Analyst Microsoft Practice Exam
QuestionQ1
Manage and secure Power BI
Save question
You need to create a Power BI theme for use across multiple reports. The theme must incorporate corporate branding for font size, color, and bar chart formatting.
What should you do?
AFrom Power BI Desktop, customize the current theme.
BFrom Power BI Desktop, use a built-in report theme.
CCreate a theme as a PBIVIZ file and import the theme into Power BI Desktop.
DCreate a theme as a JSON file and import the theme into Power BI Desktop.
0
Community Discussion
No comments yet. Be the first to start the discussion!
QuestionQ2
Manage and secure Power BI
0
Community Discussion
No comments yet. Be the first to start the discussion!
QuestionQ3
Manage and secure Power BI
0
Community Discussion
No comments yet. Be the first to start the discussion!
QuestionQ4
Prepare the data
0
Community Discussion
No comments yet. Be the first to start the discussion!
QuestionQ5
Model the data
0
Community Discussion
No comments yet. Be the first to start the discussion!
It's free
100% of the questions are free for all users. No strings attached.
No comments yet. Be the first to start the discussion!
Save question
0
Community Discussion
No comments yet. Be the first to start the discussion!
Save question
0
Community Discussion
No comments yet. Be the first to start the discussion!
Save question
0
Community Discussion
No comments yet. Be the first to start the discussion!
Save question
0
Community Discussion
No comments yet. Be the first to start the discussion!
Save question
0
Community Discussion
No comments yet. Be the first to start the discussion!
Save question
0
Community Discussion
No comments yet. Be the first to start the discussion!
Save question
0
Community Discussion
No comments yet. Be the first to start the discussion!
Save question
0
Community Discussion
No comments yet. Be the first to start the discussion!
Save question
0
Community Discussion
No comments yet. Be the first to start the discussion!
Save question
0
Community Discussion
No comments yet. Be the first to start the discussion!
Save question
0
Community Discussion
No comments yet. Be the first to start the discussion!
You have a report containing four pages. Each page has slicers for the same four fields.
Users report that when they choose values in a slicer on one page, those selections do not persist on the other pages.
You need to recommend a solution that lets users select a value once and filter results across all pages. What are two possible recommendations to meet this goal? Each correct answer provides a complete solution.
NOTE: Each correct selection is worth one point.
Choose two
ACreate a bookmark for each slicer value.
BReplace the slicers with report-level filters.
CSync the slicers across the pages.
DReplace the slicers with page-level filters.
EReplace the slicers with visual-level filters.
You have a PBIX file that imports data from a Microsoft Excel data source located on a file share in a local network.
You are informed that the Excel data source has been moved to a different location.
You need to update the PBIX file so that it uses the new location.
What are three ways to accomplish this goal? Each correct answer provides a complete solution.
NOTE: Each correct selection is worth one point.
Choose three
AFrom the Datasets settings of the Power BI service, configure the data source credentials.
BFrom the Data source settings in Power BI Desktop, configure the file path.
CFrom Current File in Power BI Desktop, configure the Data Load settings.
DFrom Power Query Editor, use the formula bar to configure the file path for the applied step.
EFrom Advanced Editor in Power Query Editor, configure the file path in the M code.
You have a Power BI semantic model containing a table named Table1. Table1 uses Import storage mode.
You need to update the model so that Table1 uses DirectQuery storage mode.
What action should you take?
ADelete Table1, and then add the table to the model again in DirectQuery storage mode.
BFrom Power Query Editor, duplicate the query for Table1.
CFrom Model view, change the storage mode of Table1 to DirectQuery.
DAdd an aggregation table to the model.
You need to establish relationships that satisfy the customer service department's reporting requirements.
What should you create?
Aa one-to-many relationship from Date[date_id] to Sales[sales_date_id] and another one-to-many relationship from Date[date_id] to Weekly_Returns[week_id]
Ba one-to-many relationship from Sales[sales_date_id] to Date[date_id] and a one-to-many relationship from Sales[sales_ship_date_id] to Date[date_id]
Can additional date table named ShipDate, a many-to-many relationship from Sales[sales_date_id] to Date[date_id], and a many-to-many relationship from Sales[sales_ship_date_id] to ShipDate[date_id]
Dan additional date table named ShipDate, a one-to-many relationship from Date[date_id] to Sales[sales_date_id], and a one-to-many relationship from ShipDate[date_id] to Sales[sales_skip_date_id]
You have a Power BI report named Orders that supports the following analysis:
Total sales over time
The count of orders over time
New and repeat customer counts
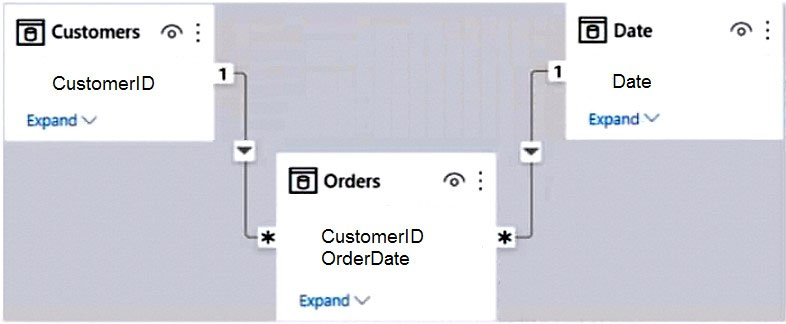
The data model size is nearing the limit for a dataset in shared capacity. The model view for the dataset is shown in the following exhibit.
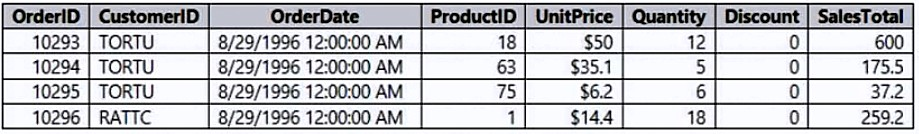
The data view for the Orders table is shown in the following exhibit.
The Orders table is related to the Customers table by using the CustomerID column. The Orders table is related to the Date table by using the OrderDate column.
For each of the following statements, select Yes if the statement is true. Otherwise, select No.
Yes or No
Yes
No
Statements
Summarizing Orders by the CustomerID, OrderID, and OrderDate columns will reduce the model size while still supporting the current analysis.
Removing the CustomerID column from Orders will reduce the model size while still supporting the current analysis.
Removing the UnitPrice and Discount columns from Orders will reduce the model size while still supporting the current analysis.
You have a Power BI report with one page. That page includes two line charts and one bar chart.
You need to ensure that users can perform the following actions for all three visuals:
Switch the measures used in the visuals.
Change the visualization type.
Add a legend.
The solution must minimize development effort.
What should you do?
ACreate a bookmark for each acceptable combination of visualization type, measure, and legend in the bar chart.
BEdit the interactions between the three visuals.
CEnable personalization for the report.
DEnable personalization for each visual.
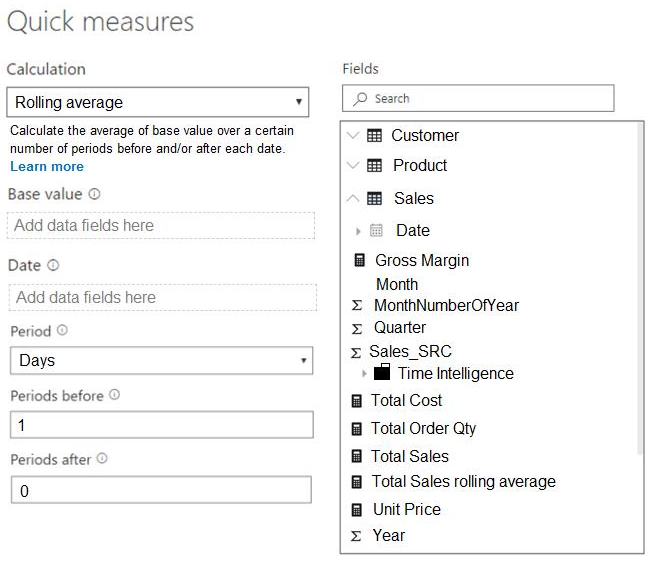
You are creating a quick measure as shown in the following exhibit.
You need to create a monthly rolling average measure for Sales over time.
How should you configure the quick-measure calculation?
Select
Base value:
Date:
Period:
You have a Power BI report that includes a bar chart. The bar chart shows sales by country.
You need to ensure that a screen reader can access a summary of the data displayed on the bar chart.
What should you configure on the bar chart?
Aconditional formatting
Balt text
Cthe tab order
Dthe layer order
You have a Power BI semantic model.
You need to configure row-level security (RLS) to limit data access for users with Viewer permissions.
Which three actions should you take, in sequence?
Drag & Drop
Assign the users the Contributor role for the Power BI workspace.
Publish the semantic model.
Assign the users the Member role for the Power BI workspace.
From the Power BI service, assign the new RLS role to the users.
From Microsoft Power BI Desktop, create a new RLS role by using a DAX filter.
You are reviewing a Power BI data model.
You have a calculated table with the following definition:
You need to determine the result of the DAX expression.
Which rows are returned in ProductList?
Aall the rows in ProductsGroupB that have a matching row in ProductsGroupA
Ball the rows in both tables
Call the rows in ProductsGroupA that have a matching row in ProductsGroupB
Dall the rows in ProductsGroupA that have no matching row in ProductsGroupB.
You have a Power BI dataset containing quarterly sales performance data.
You need to allow managers to review the data in a format that meets these requirements:
Is optimized for printing.
Renders data in Microsoft Excel, Word, PowerPoint, and PDF formats.
What should you create?
Aa template app
Ba dashboard
Ca paginated report
Dan interactive report
You have a Power BI workspace.
You need to create two reports that meet these requirements:
Report1: Optimized for printing and can be delivered to users through a scheduled email subscription
Report2: Optimized for dynamic user interactivity
Which format should you use for each report?
Select
Report1:
Report2:
HOTSPOT -
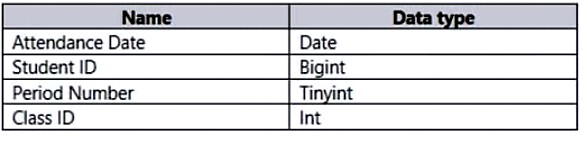
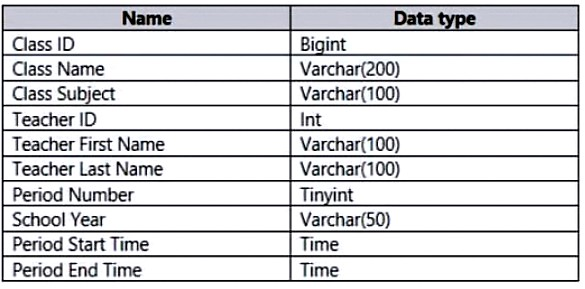
You plan to create a Power BI dataset to analyze school attendance. Data will come from two separate views, named View1 and View2, in an Azure SQL database.
View1 contains the columns shown in the following table.
View2 contains the columns shown in the following table.
The views can be related by using the Class ID column.
Class ID uniquely identifies the specified class, period, teacher, and school year. For example, the same class can be taught by the same teacher during two different periods, but the class will have a different Class ID.
You need to design a star-schema data model using data from both views. The solution must support the following analysis:
The number of classes that occur by period
The number of students in attendance by period and by day
The average number of students attending a class each month
In which table should you include the Teacher First Name and Period Number fields?
Select
Teacher First Name:
Period Number:
You have four sales regions, each with multiple sales managers.
You implement row-level security (RLS) in a data model and assign the applicable mail-enabled security group to each role.
You have sales reports that allow analysis by region. Sales managers can view sales records for their own region, but are prevented from viewing records for other regions.
A sales manager moves to another region.
You need to ensure that the sales manager can view the correct sales data.
What should you do?
AChange the Microsoft Power BI license type of the sales manager.
BFrom Microsoft Power BI Desktop, edit the Row-Level Security setting for the reports.
CManage the permissions of the underlying dataset.
DRequest that the sales manager be added to the correct Azure Active Directory group.
You need to create a dataset.
Which dataset mode should you use?
AImport
BDirectQuery
CComposite
Dlive connection
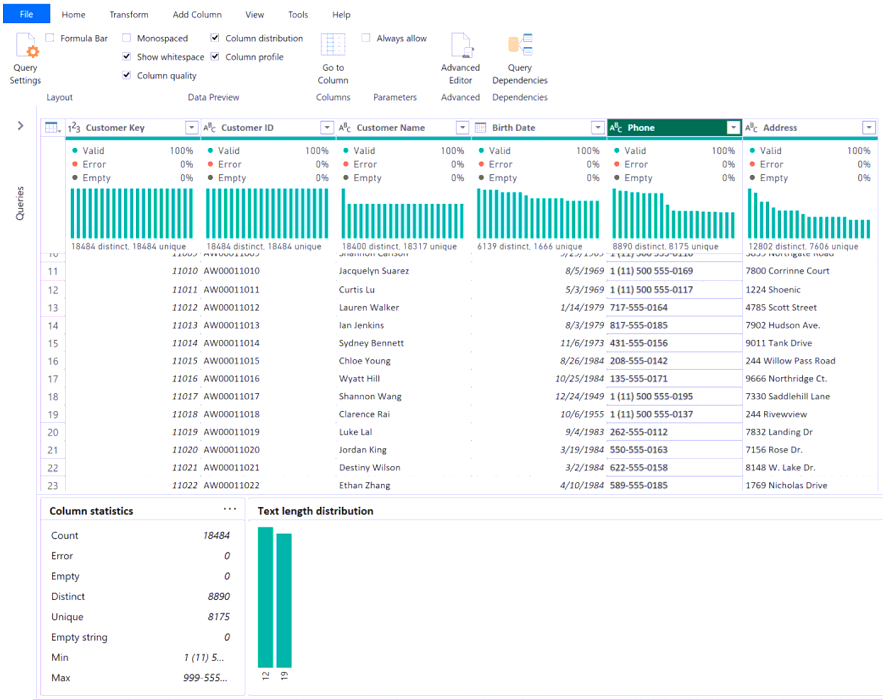
A Power Query Editor query contains customer data, as shown in the following exhibit.
Select
Some values in the column are repeated.
To standardize values in the Phone column to 10 digits and exclude country calling codes,
You have a Power BI semantic model containing a table named Table1. Table1 has the following columns:
WebsiteName
URL
You need to create a report named Report1 that includes a table visual. The solution must meet these requirements:
Display the website name.
Allow users to navigate to the website's URL by selecting the website name.
What should you use?
Adata categories
BConditional Formatting
Cinline hierarchy labels
DURL icons
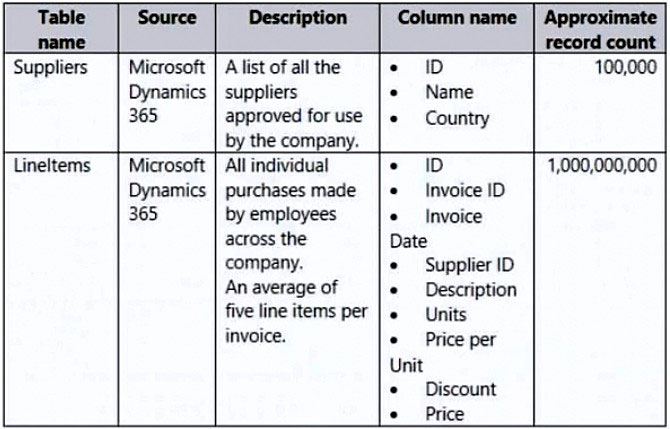
You have a Power BI report for the procurement department. The report includes data from the following tables.
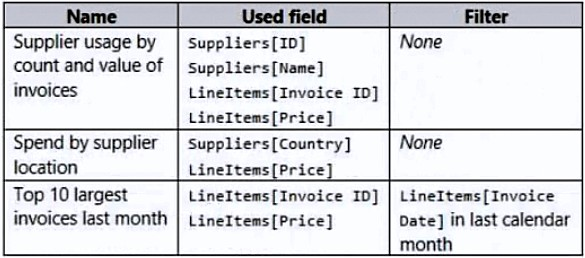
A one-to-many relationship exists from Suppliers to LineItems, using the ID and Supplier ID columns. The report includes the visuals shown in the following table.
You need to reduce the dataset size without affecting the visuals. What should you do?
AMerge Suppliers and LineItems.
BRemove the LineItems[Description] column.
CRemove the rows from LineItems where LineItems[Invoice Date] is before the beginning of last month.
DGroup LineItems by LineItems[Invoice ID] and LineItems[Invoice Date] with a sum of LineItems[Price].
You import a Microsoft Excel spreadsheet into Power Query Editor and name the query Sales_Spreadsheet.
Sales_Spreadsheet contains these columns:
Customer ID
Customer Name
Date
Total Sales Amount
You plan to use the Sales_Spreadsheet query to load two tables, named Customer and Sales, into the associated semantic model. The tables are related by the Customer ID column in each query. The solution must satisfy these requirements:
The Customer query must include the Customer ID and Customer Name columns.
The Sales query must include the Customer ID, Date, and Total Sales Amount columns.
Power Query logic must be consolidated to prevent duplicated logic across the queries and ensure that updates occur in one location.
Identify how to create the Sales query and what to do with the Sales_Spreadsheet query before loading the model.
Select
Sales:
Sales_Spreadsheet:
You have a Power BI semantic model containing a table named Opportunity.
The Opportunity table has a Qualification column whose values range from 0 to 1.
You need to create a measure that scores opportunities as low, medium, or high.
Community Discussion