Loading provider exams...
Know a question that should be here? Contribute to this exam
Loading provider exams...
Which statement concerning automation connectors in FortiAnalyzer is correct?
That's the end of the preview
100% of the questions are free for all users.
No strings attached.
What is the purpose of executing the command diagnose sql status sqlplugind?
You need to locate logs associated with a suspected attack on your network.
You must use an interface that lists and organizes all identified threats within your selected timeframe. You must also be able to quickly export the information to a PDF file.
Where can you go to complete this task?
Which two actions should you perform to view compromised hosts on FortiAnalyzer?
You need to locate a particular security event log in the FortiAnalyzer logs shown in FortiView, but you have not been able to find it so far.
Which two tasks should you carry out to investigate the reason for this issue?
Go ad-free and unlock Learn Mode, Exam Mode, AstroTutor AI and every premium tool — everything you need to walk in prepared, and confident.
As an analyst, you often search the log view with identical parameters.
Rather than repeatedly defining the same search filters, what can you do to save time?
When handling incidents in FortiAnalyzer, which fact must an analyst know?
Refer to the exhibit.
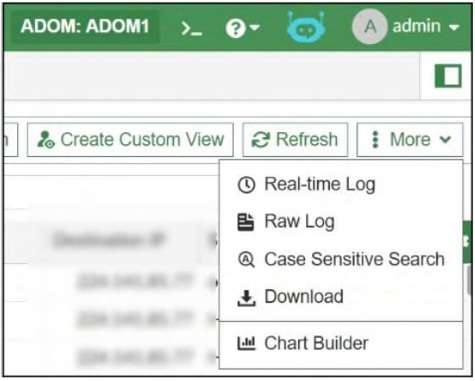
What is the purpose of using the Chart Builder feature in FortiAnalyzer 7?
Refer to the exhibit.
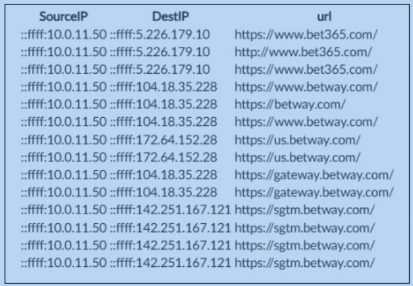
An analyst needs to create a dataset that retrieves every gambling website visited by end users.
Which FortiAnalyzer SQL query produces the result displayed in the exhibit?
Which statement is true about sending notifications for incident updates?
An administrator on your team has set up multiple reports to run periodically. Management has asked that all newly generated reports be sent to a company email inbox for accessibility.
The mail server is already configured on FortiAnalyzer.
Which item must be configured on FortiAnalyzer to send emails when the reports are generated?
What does FortiAnalyzer do when a device log has no matching parser?
An analyst must transfer reports between two ADOMs.
Which two statements are correct?
Which tasks can FortiAI perform on FortiAnalyzer?
In firmware version 7.6, which database does an on-premises FortiAnalyzer use to store logs?
Which two modules can be imported and exported between FortiAnalyzer ADOMs?
Refer to the exhibit.
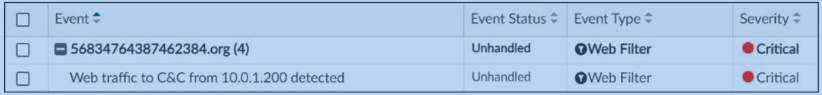
Which statement is correct about the displayed event?
Which two methods can be used to send notifications when an event is generated by an event handler?
Which two statements concerning playbook execution are true?
Refer to the exhibits.
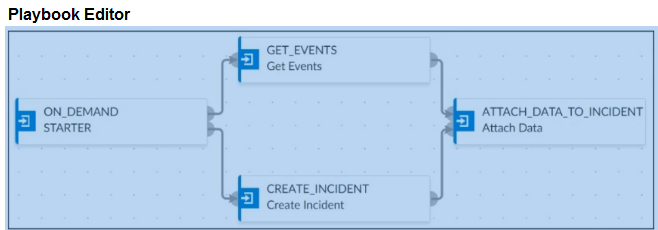
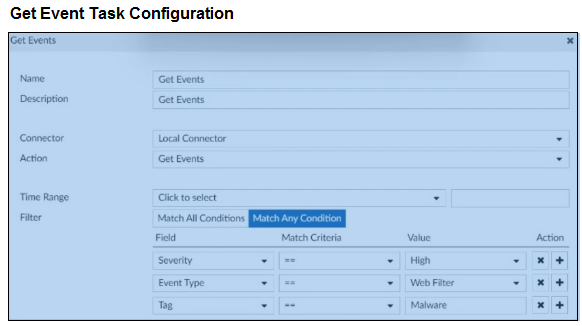
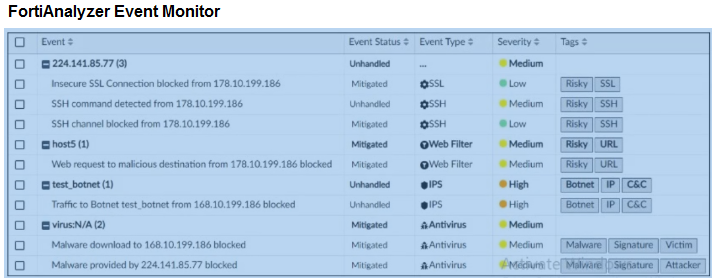
Assume that these are all events that exist on FortiAnalyzer.
How many events will be added to the incident created after this playbook runs?
Which statement accurately identifies a difference between templates and reports?
Community Discussion