QuestionQ18
VerifiedData science conceptsA Data Scientist is training a model and used scikit-learn to create a partial dependency plot with the following command:

The resulting charts are:
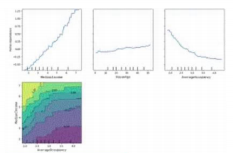
Which statements reflect what the charts depict?
Choose three
Community Discussion