QuestionQ88

VerifiedImplement and manage semantic models

You have a Microsoft Power BI report named Report1 that uses a Fabric semantic model.

Users discover that Report1 renders slowly.

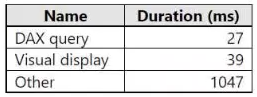
You open Performance analyzer and identify that a visual named Orders By Date is the slowest to render. The duration breakdown for Orders By Date is shown in the following table.
Question Image

What will provide the greatest reduction in the rendering duration of Report1?

Explanation

Reducing the number of visuals in the report provides the greatest performance improvement because the 'Other' duration (1047 ms) is significantly higher than DAX query (27 ms) and rendering (39 ms) combined. 'Other' time includes waiting for other visuals to complete and background processing. Fewer visuals reduce overall rendering load and inter-visual dependencies, directly addressing the bottleneck.

Community Discussion

No comments yet. Be the first to start the discussion!