QuestionQ48

VerifiedAdvanced Analytics - Theory, Application, and Interpretation of Results for Eight Methods
Question Image

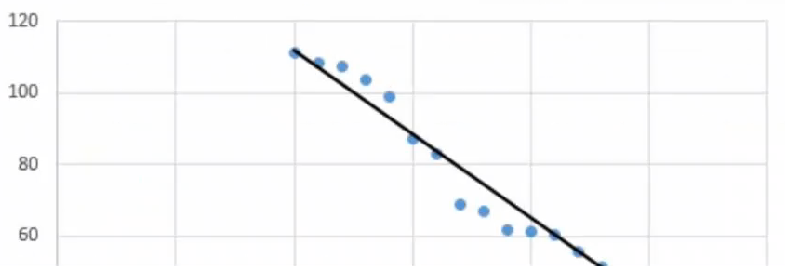
Refer to the exhibit.

What is the approximate R-squared value of a linear regression model fitted to the data represented in this scatterplot?

Explanation

The data show a very strong linear relationship with only small deviations from the fitted line, so the model explains approximately 96% of the variation. R-squared values range from 0 to 1.

Community Discussion

No comments yet. Be the first to start the discussion!