QuestionQ87
VerifiedModeling, Analysis, and OutcomesSIMULATION
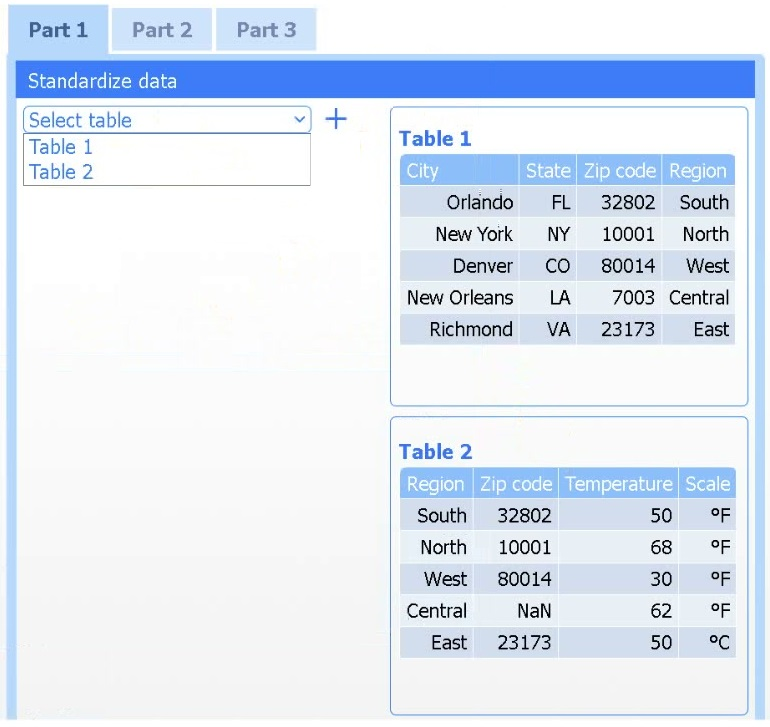
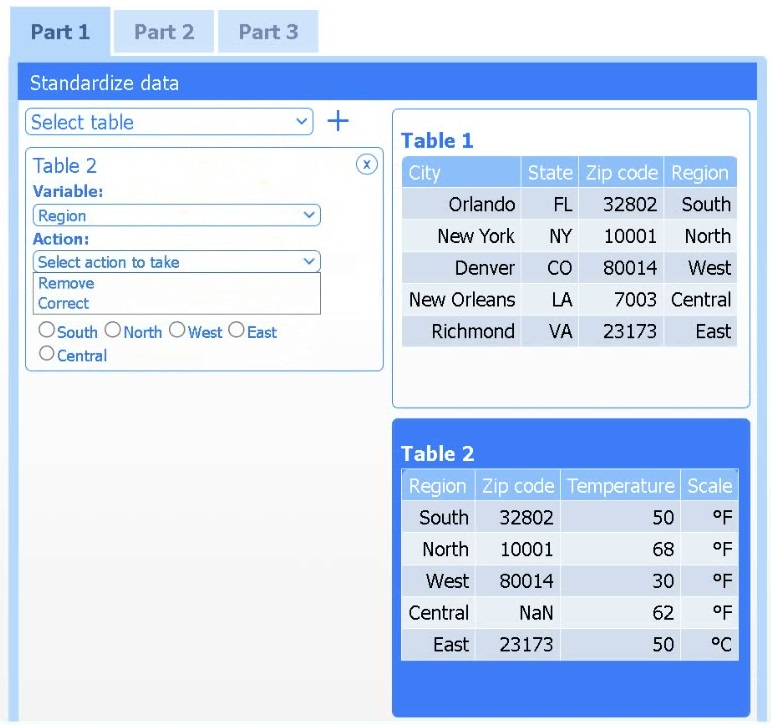
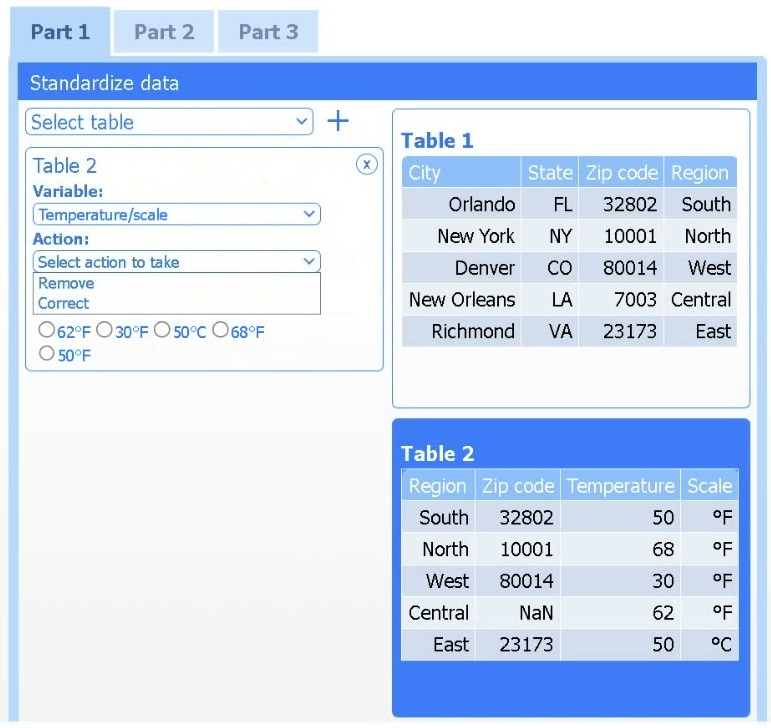
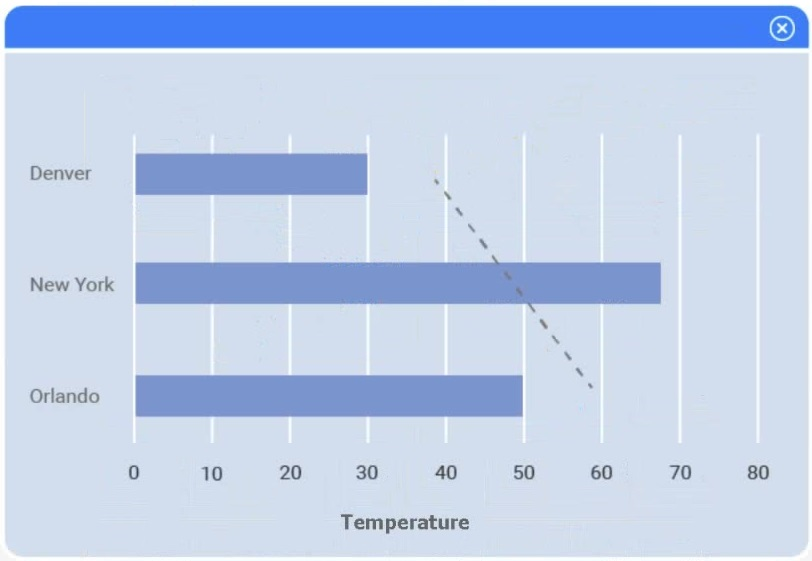
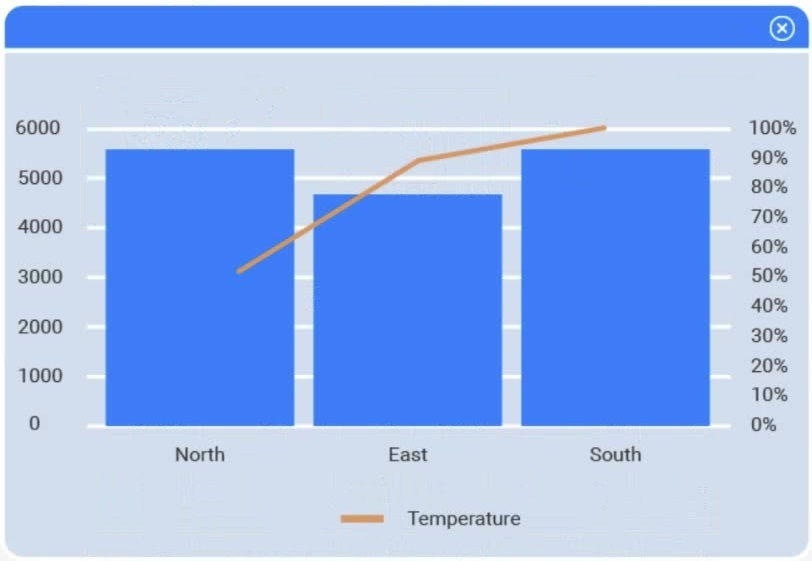
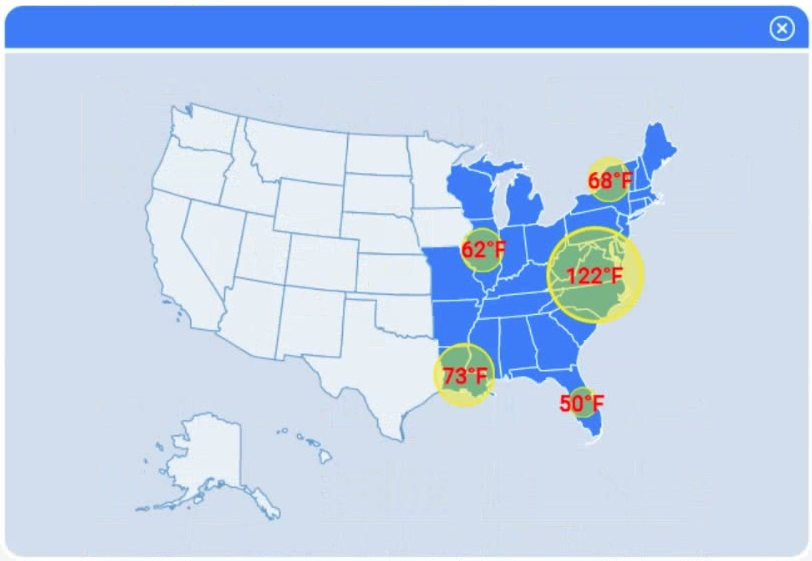
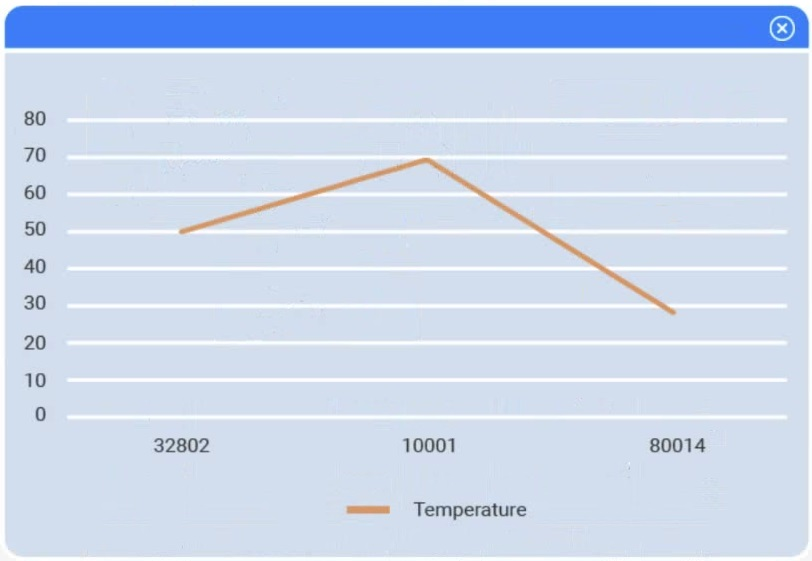
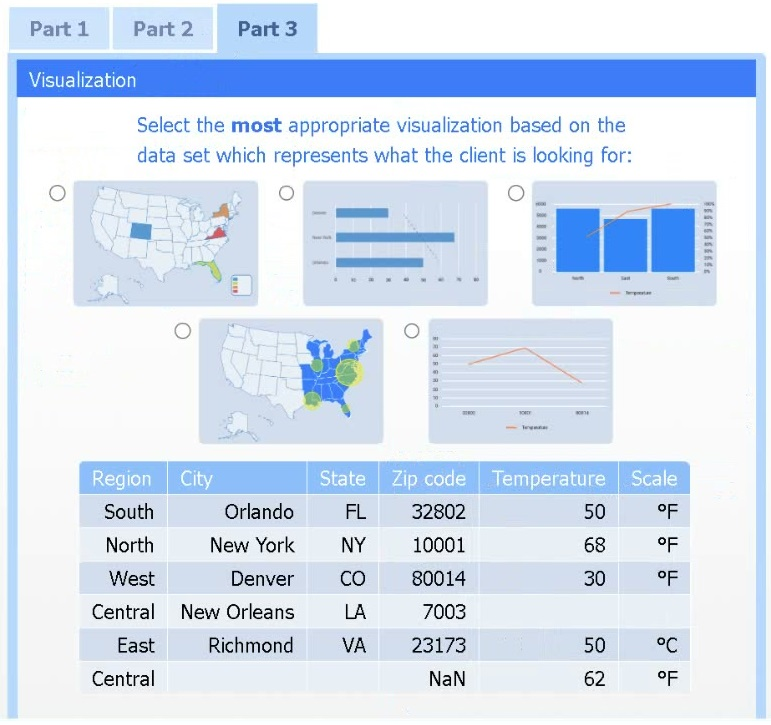
A client has collected weather data about the regions that have high temperatures. The client wants a visualization to better understand the data.
INSTRUCTIONS
Part 1
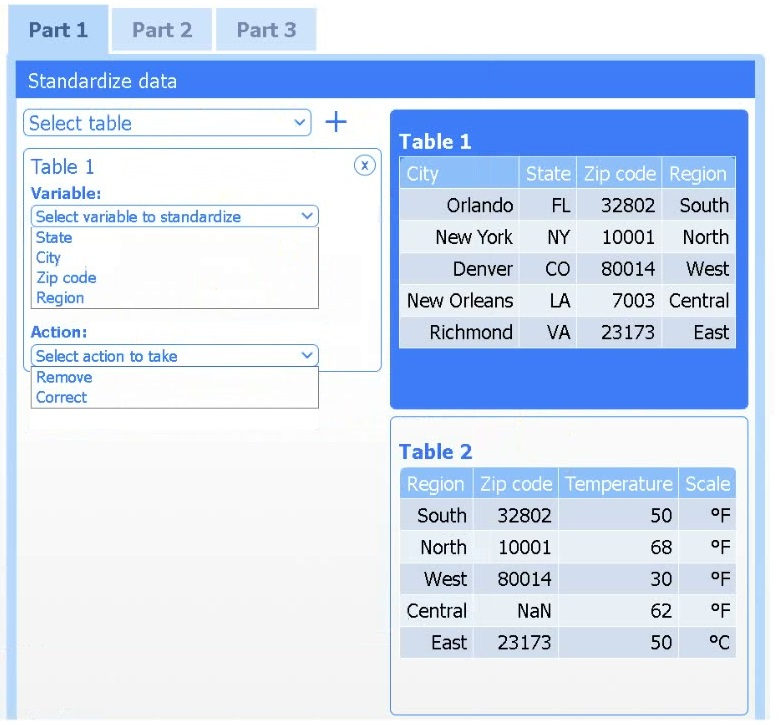
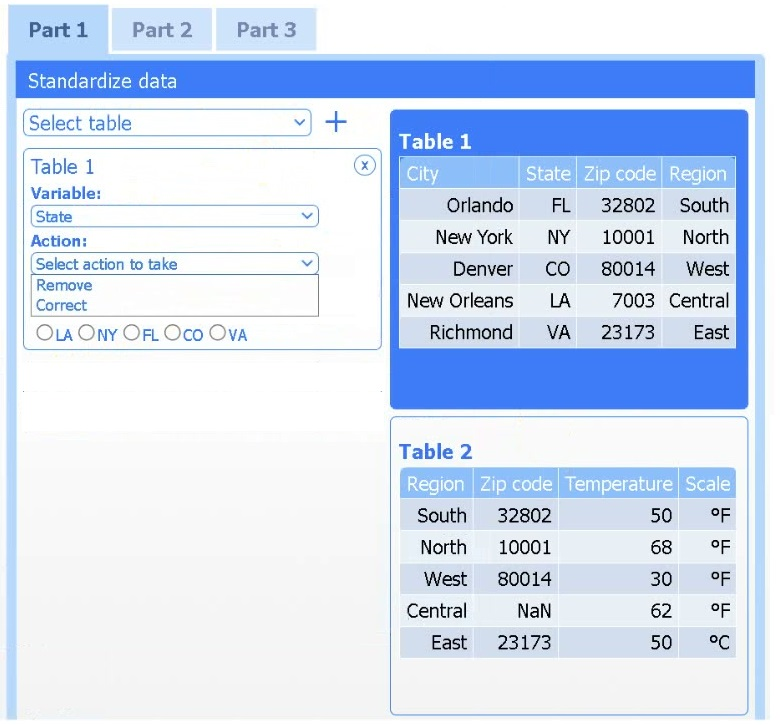
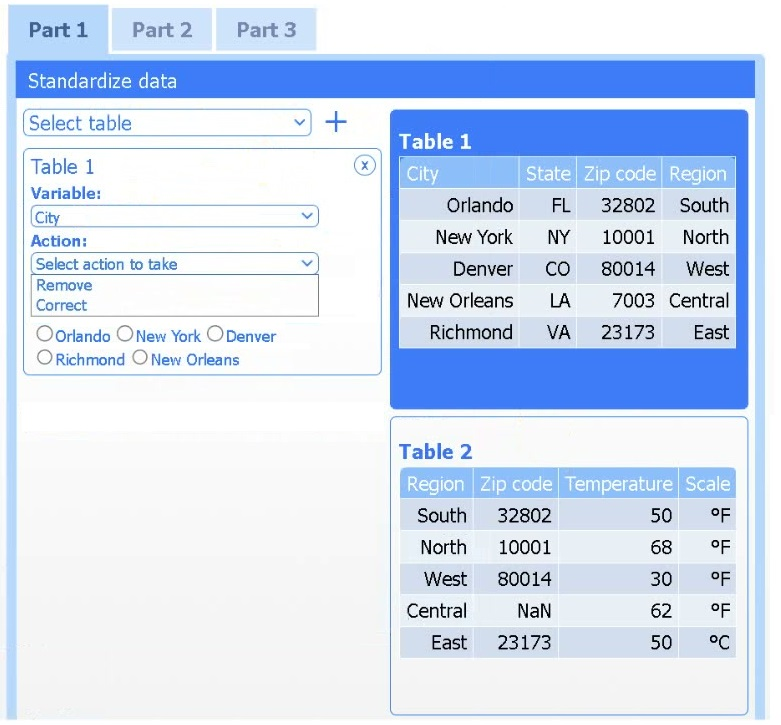
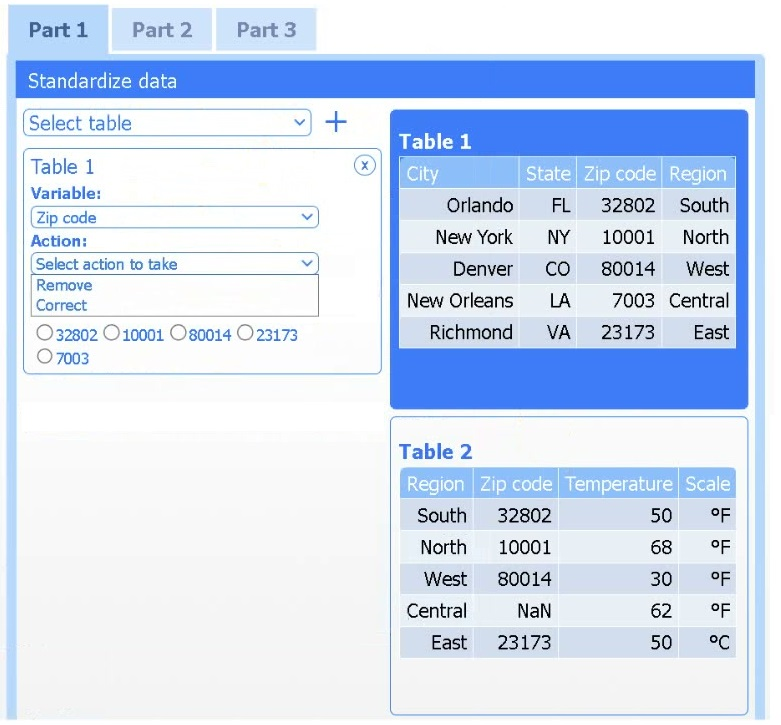
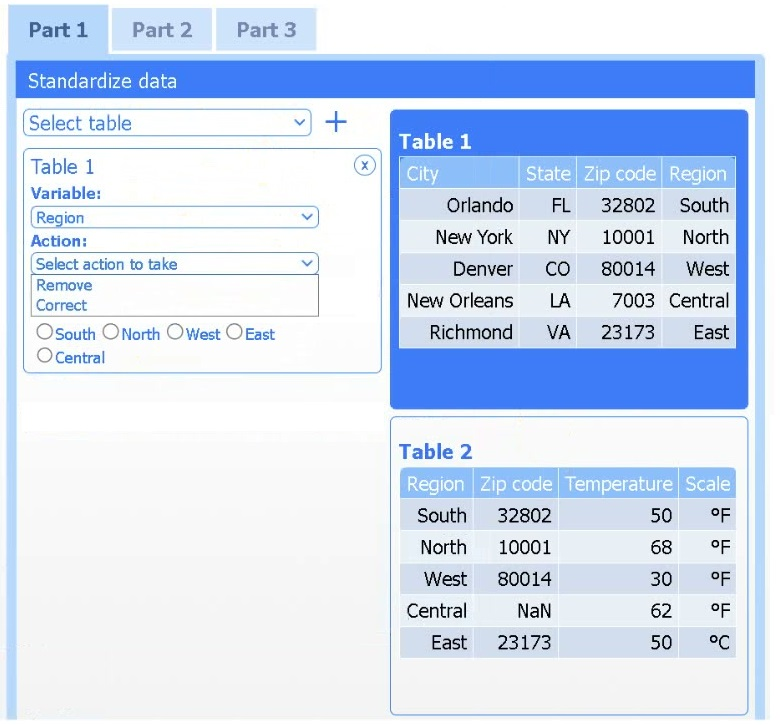
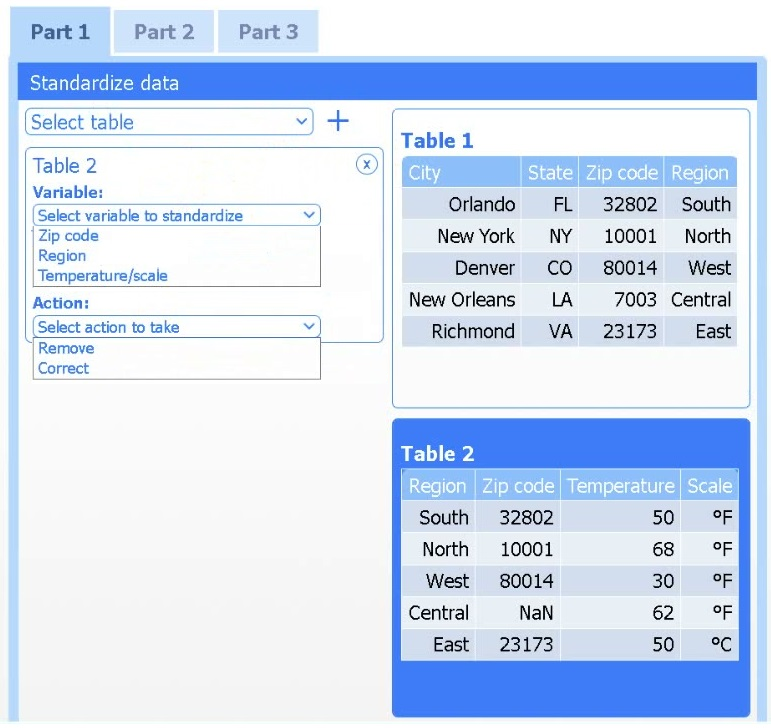
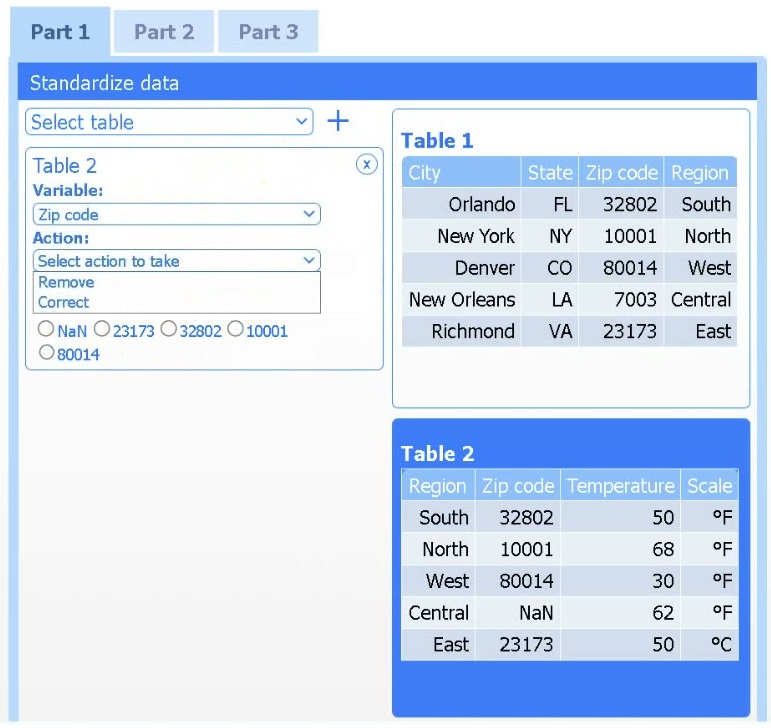
Review the provided charts and use the drop-down menu to choose the most appropriate way to standardize the data.
Part 2
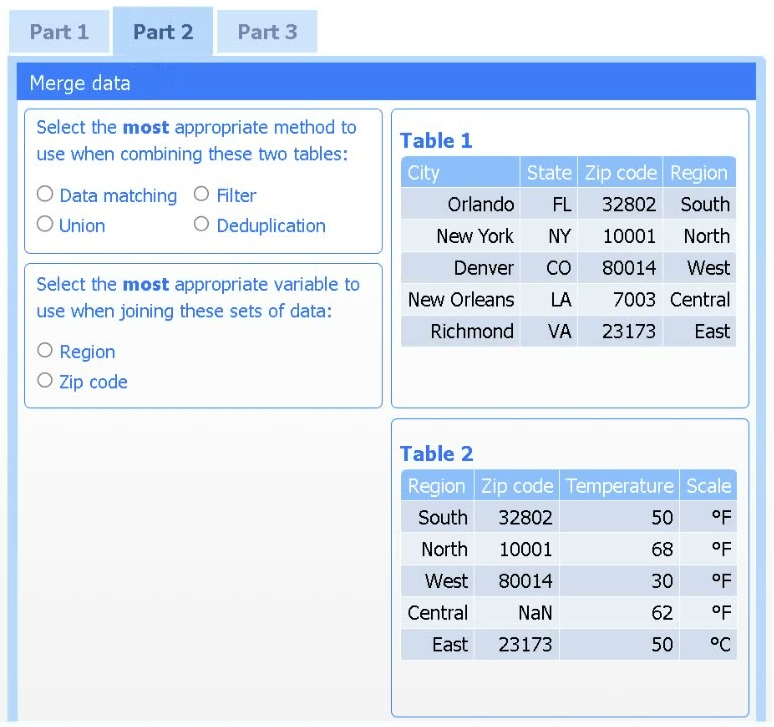
Answer the questions to determine how to create a single data set.
Part 3
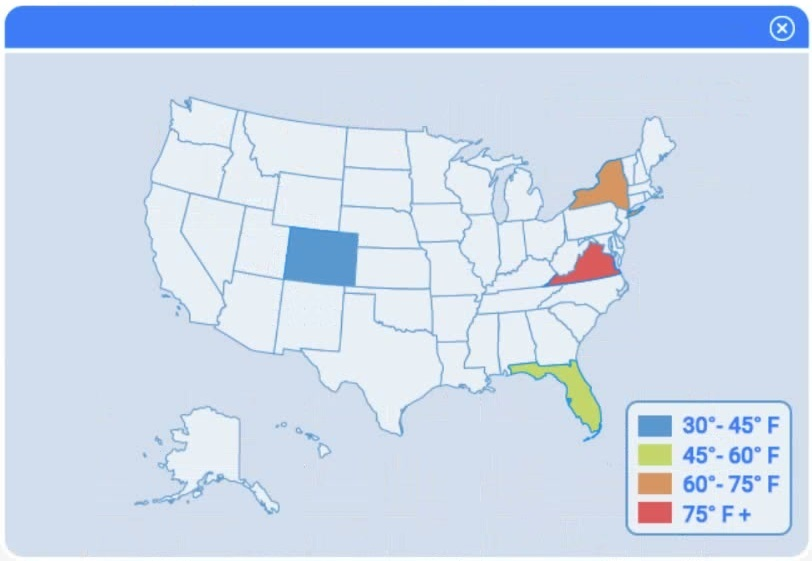
Choose the visualization that is most appropriate for the data set and represents what the client is seeking.
If you want to restore the simulation to its initial state at any time, click the Reset All button.
Community Discussion